Learn about

Climate Change

Climate Education

Climate Change in Grand Rapids

We are, and have been, experiencing the effects of climate change in Grand Rapids. To avoid the worst impacts, we are working to reduce our greenhouse gas emissions (mitigation) and prepare for known changes like increased extreme weather (adaptation). Explore the sections below to learn more about the science behind global climate change and what we expect locally for the future of Grand Rapids, Michigan.

Climate Change Science

Climate change describes long-term shifts in temperatures and weather patterns. Earth's climate has changed many times across billions of years and will continue to change. Many of these changes are caused by natural processes and cycles that increase energy output from the Sun or volcanic activity on Earth.

However, since the 1800s, human activities have been the main force behind changings Earth's climate. Each year, more carbon dioxide (CO₂) is released into the air, primarily by burning fossil fuels like coal, oil and gas, than all of Earth's oceans, forests, and soil can remove. This is causing more CO₂ to build up and is changing the Earth's temperature.

Weather and Climate

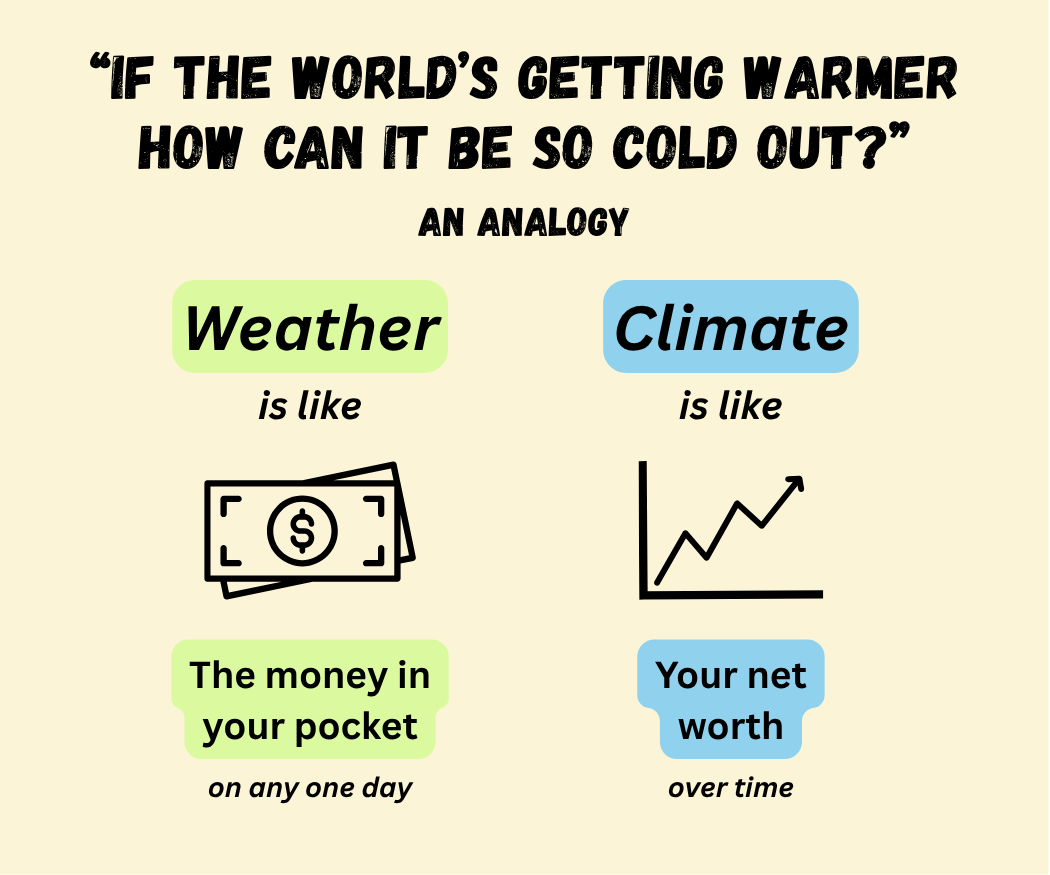
Though they are closely related, weather and climate are not the same thing. Climate is what you expect for a region (based on past trends) and weather is what actually happens (based on current atmospheric conditions).

Weather

Short-term changes in the atmosphere – which can be that it’s currently raining out, or that we haven’t gotten much snow yet this winter.

We use weather to describe short amounts of time like a week, a season, or a year.

Climate

A long-term average of weather over decades or centuries- at least 20 to 30 years.

So, while one year may have been really cold, when you look at the average change over 20-30 years, our winters are getting warmer with more rain.

Global Temperature Trends

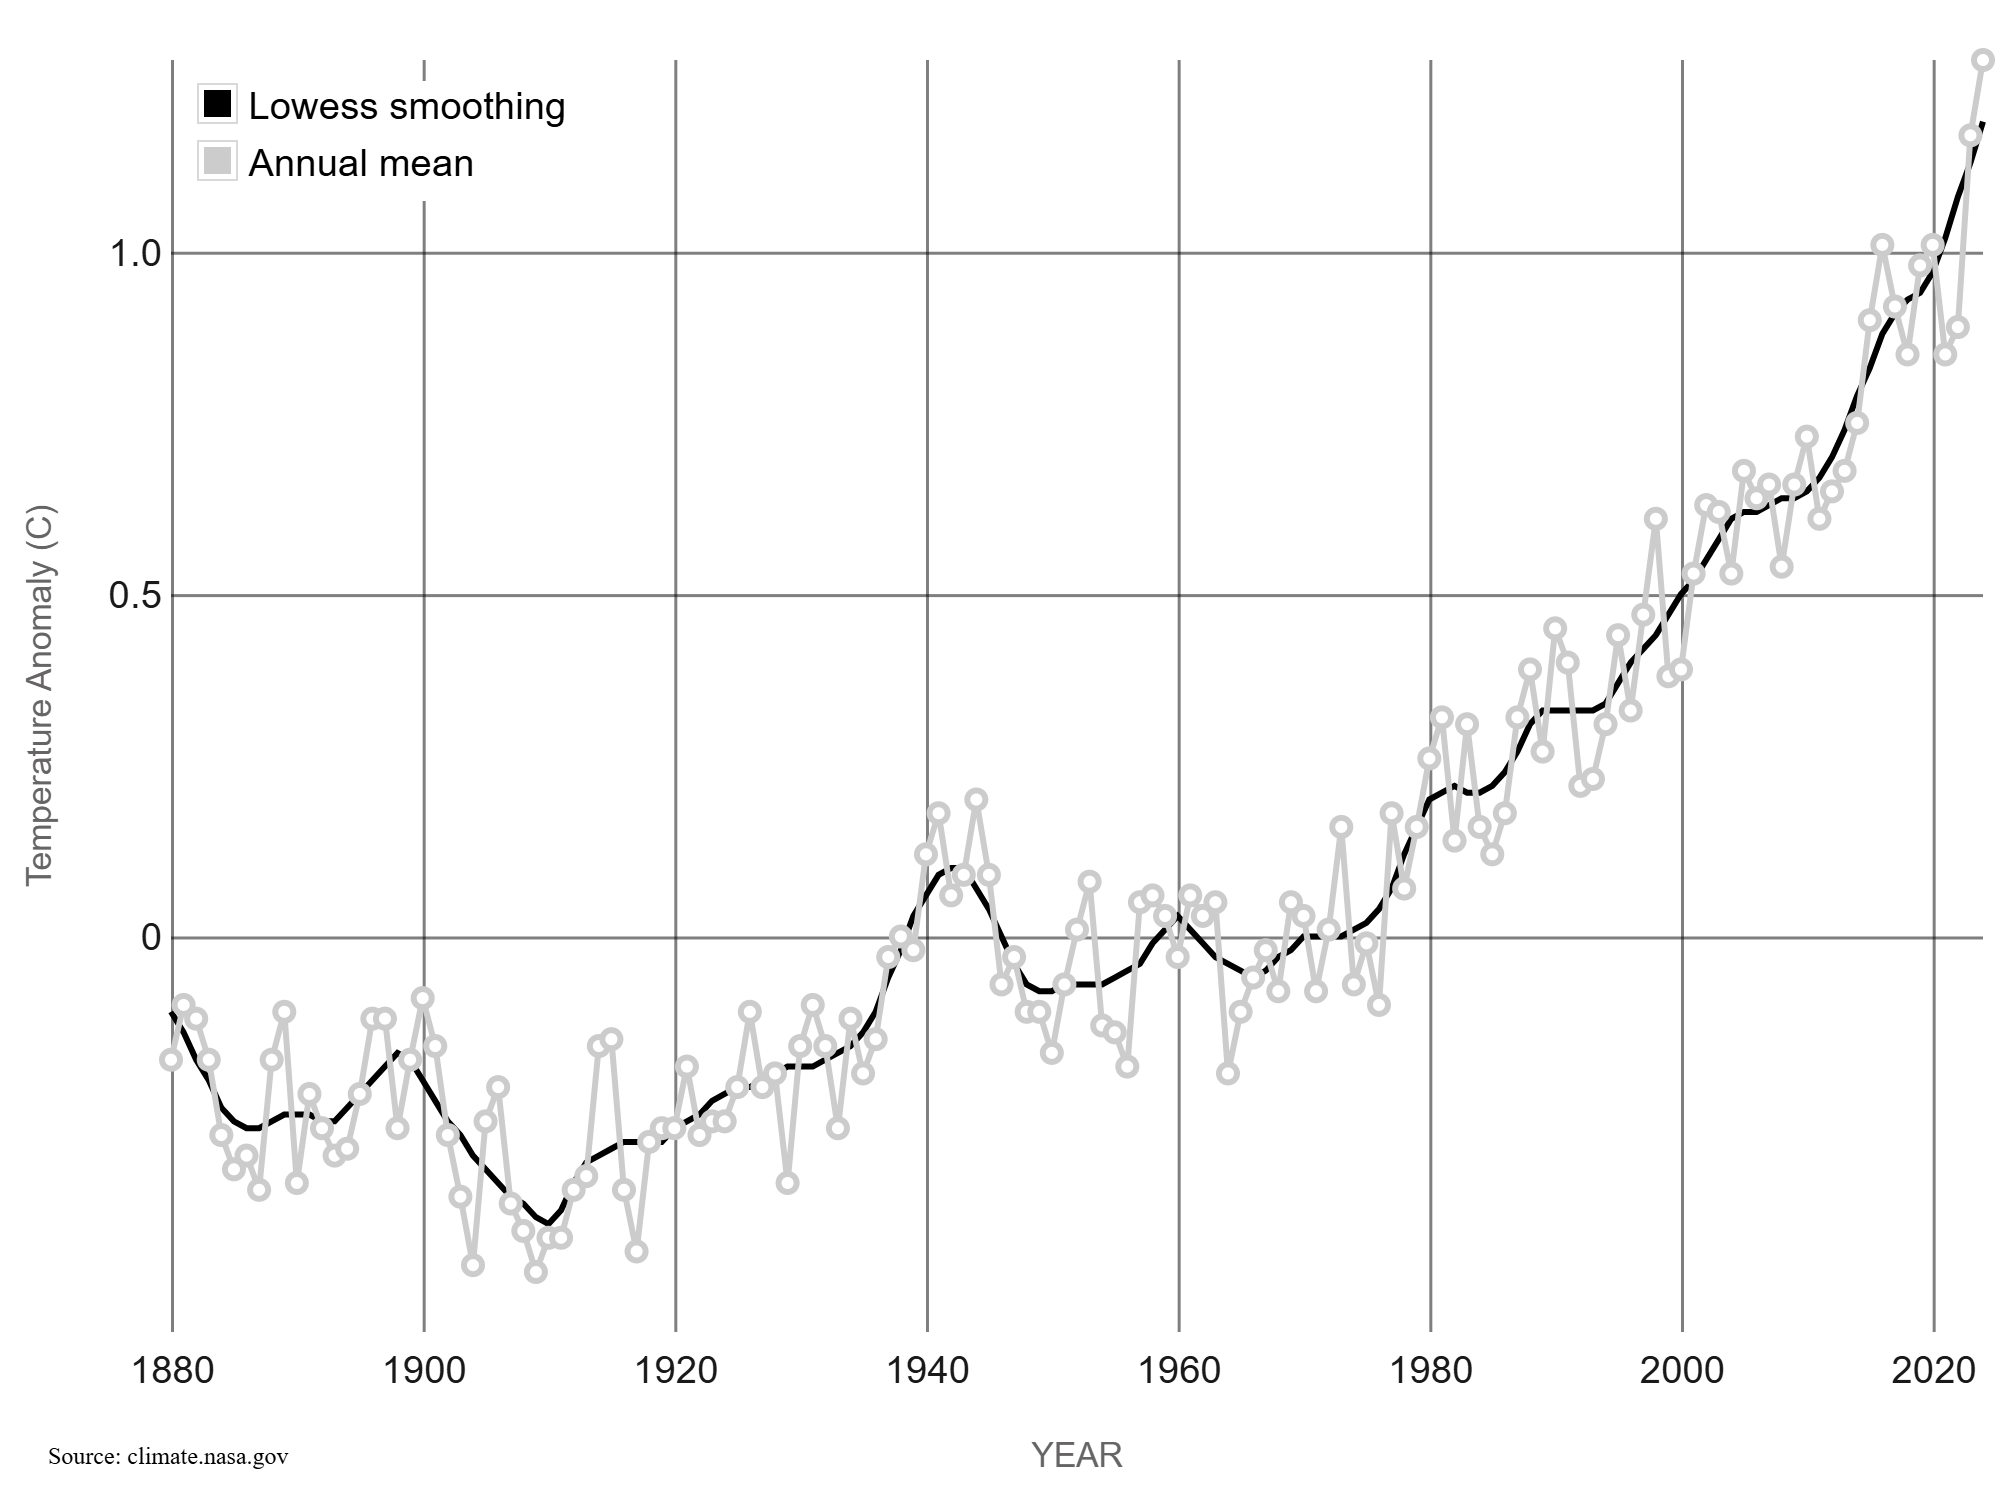
Since record-keeping of global temperature began in the year 1880, the hottest year on record remains 2024. Some years are hotter and some are colder, but the trend across the whole timeline is that, overall, the Earth is getting warmer.

In the graph to the right, each small white dot represents that year's change in global surface temperature compared to the average temperature between 1951 to 1980 (30 years). These dots represent the average temperature that year (weather).

The solid black line is the trend of weather patterns (climate) and shows an increase in the global surface temperature in the past ~150 years.

For up to date tracking on global temperatures, visit NASA's Global Climate Change Global Temperature page.

The Greenhouse Effect

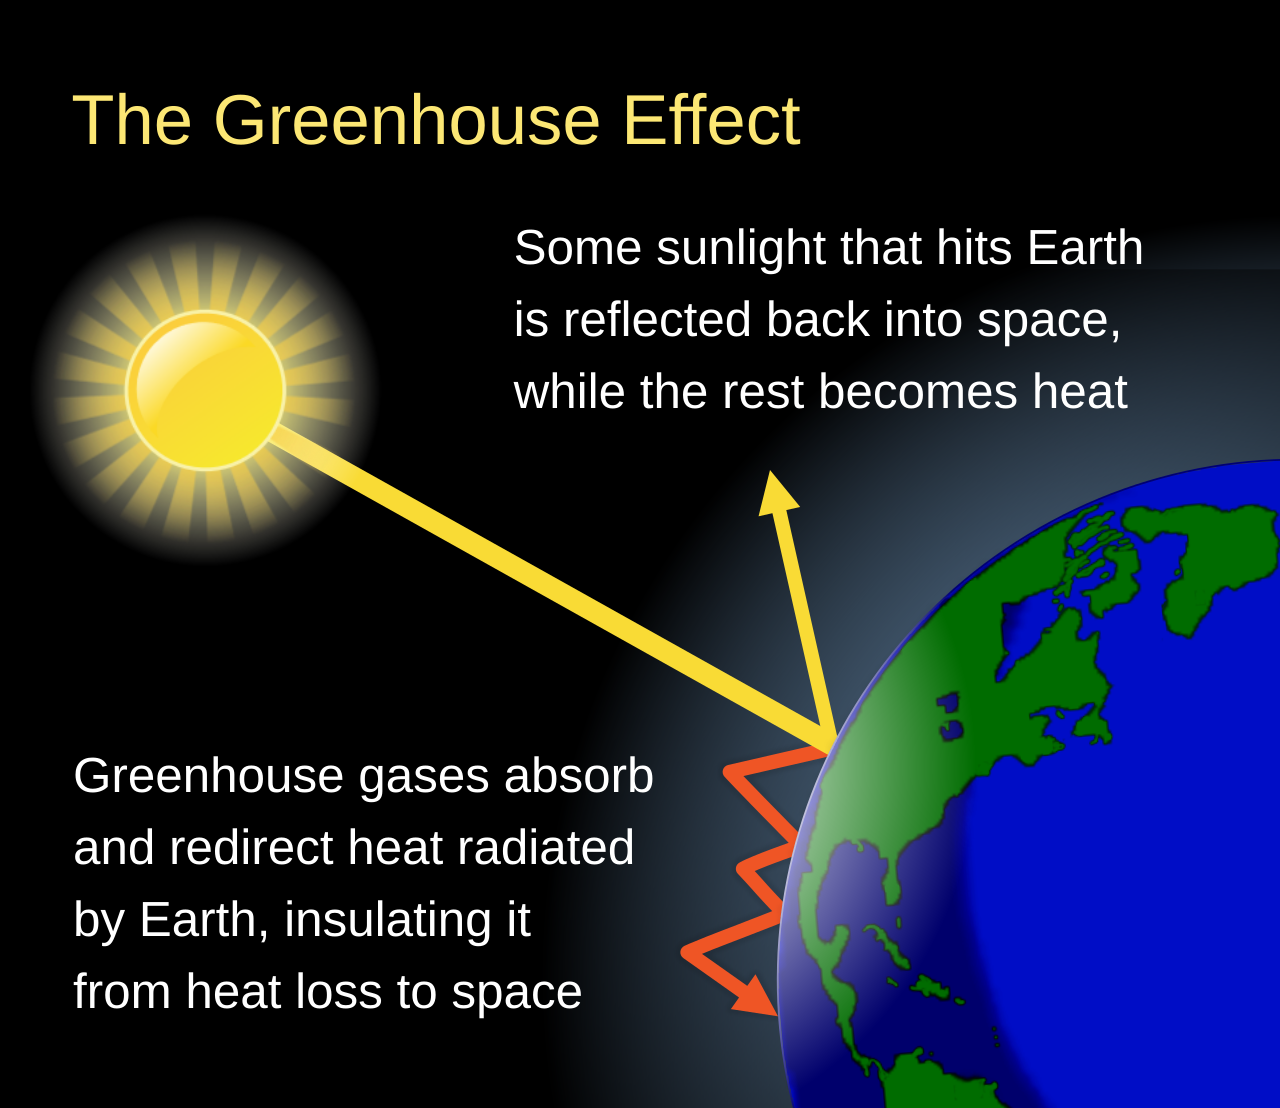
The greenhouse effect describes how our atmosphere can trap heat, therefore warming the surface of the Earth, similar to a clear, outdoor, greenhouse for plants. The types of gas in our air that trap the most heat are called greenhouse gasses, or GHGs.

Without any GHGs, Earth would become too cold to support life. However, the more GHGs released into the atmosphere, the warmer the planet becomes.

The Sun’s energy (through solar radiation) shines down and heats the Earth. Some of that heat energy bounces off or is reflected by clouds in the atmosphere, the rest warms up the Earth and gives off heat energy. The natural blanket traps about half of that energy keeping the earth a temperature we can live in.

Once the Earth’s surface is warm, it gives off excess energy to space as invisible infrared radiation. This release of energy by the Earth is what warms the surface of the planet.

This natural "blanket" of heat-trapping gases prevents the Earth from freezing solid and allows for life to exist. 

However, since the 1800s, human activities have been the main force behind changings Earth's climate. More and more CO2, a very strong GHG, has been released and is increasing the thickness of the "blanket." 

Greenhouse Gases

The types of gas in our air that trap the most heat are called greenhouse gasses, or GHGs.

  • Carbon dioxide (CO2)
  • Methane (CH4)
  • Nitrous oxide (N2O)
  • Fluorinated gases

For each GHG a Global Warming Potential (GWP) was developed to allow comparisons of the global warming impacts of different gases. Specifically, it is a measure of how much energy the emissions of 1 ton of a gas will absorb over a given period of time, typically a 100-year time horizon, relative to the emissions of 1 ton of carbon dioxide (CO2).

Gases with a higher GWP absorb more energy, per ton emitted, than gases with a lower GWP, and thus contribute more to warming Earth.

The main greenhouse (heat-trapping) gases caused by human activity are:

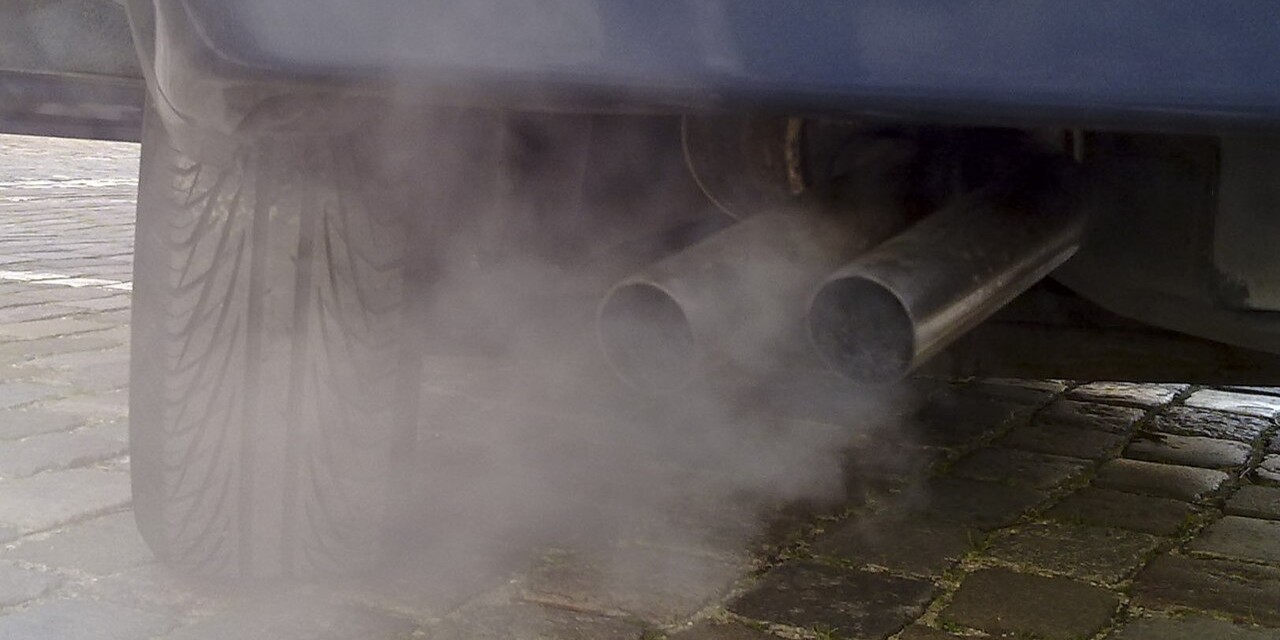
Close up of a car exhaust pipe and a cloud of gas emissions.

Carbon Dioxide (CO₂)

Carbon dioxide (CO2) has contributed more warming than any other GHG and it stays in our atmosphere the longest (between 300 and a 1,000 years). 

The main human activity that produces carbon dioxide is the burning of fossil fuels such as coal, natural gas, and oil. In 2022, CO2 accounted for 80% of all U.S. GHG emissions from human activities.

CO2 is the reference gas to compare the global warming potential (GWP) of other GHGs. Therefore, the GWP of CO2 equals 1.

Source: Environmental Protection Agency
Methane (CH₄)

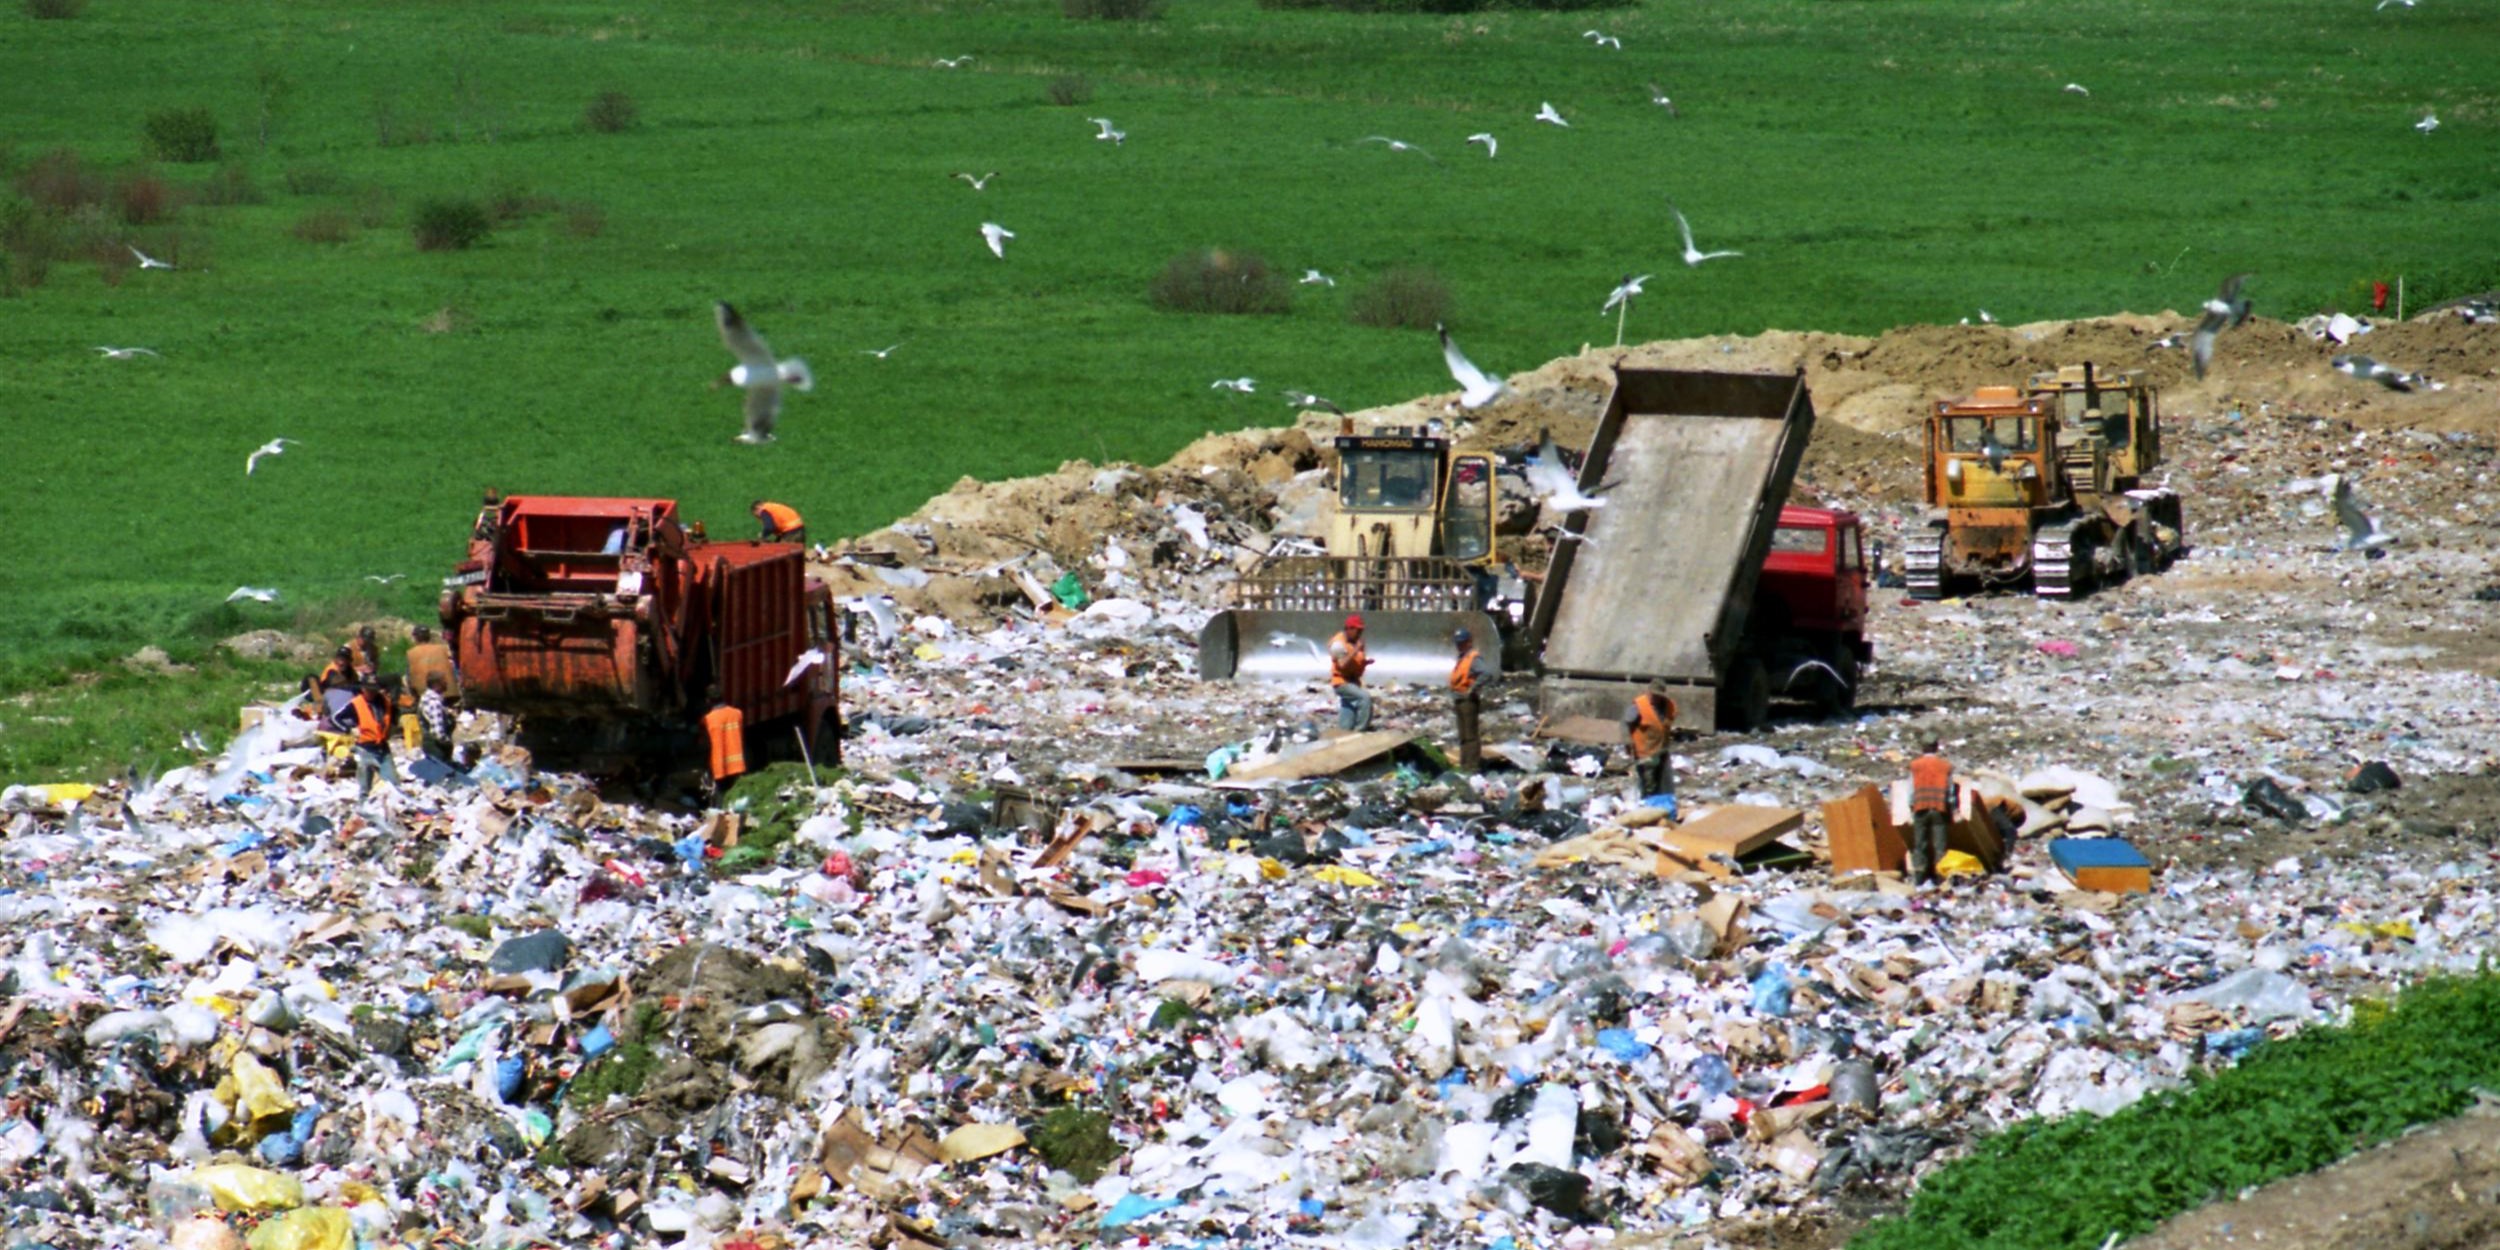
Globally, 50% to 65% of total methane (CH4) emissions come from human activities. Domestic livestock produce CH4 as part of their normal digestive process. These emissions are considered human-related because humans raise these animals for food and other products.

Methane is also generated during the treatment of wastewater and by landfills when organic waste decomposes.

Methane's spends less time in the atmosphere compared to carbon dioxide (CO2), but is more efficient at trapping the heat in sunlight. The global warming potential of CH4 is 28.

Source: Environmental Protection Agency
Nitrous Oxide (N₂O)

Nitrous oxide (N2O) emissions do occur naturally through many sources associated with the nitrogen cycle: the natural circulation of nitrogen between plants, animals, soil, water, and air.

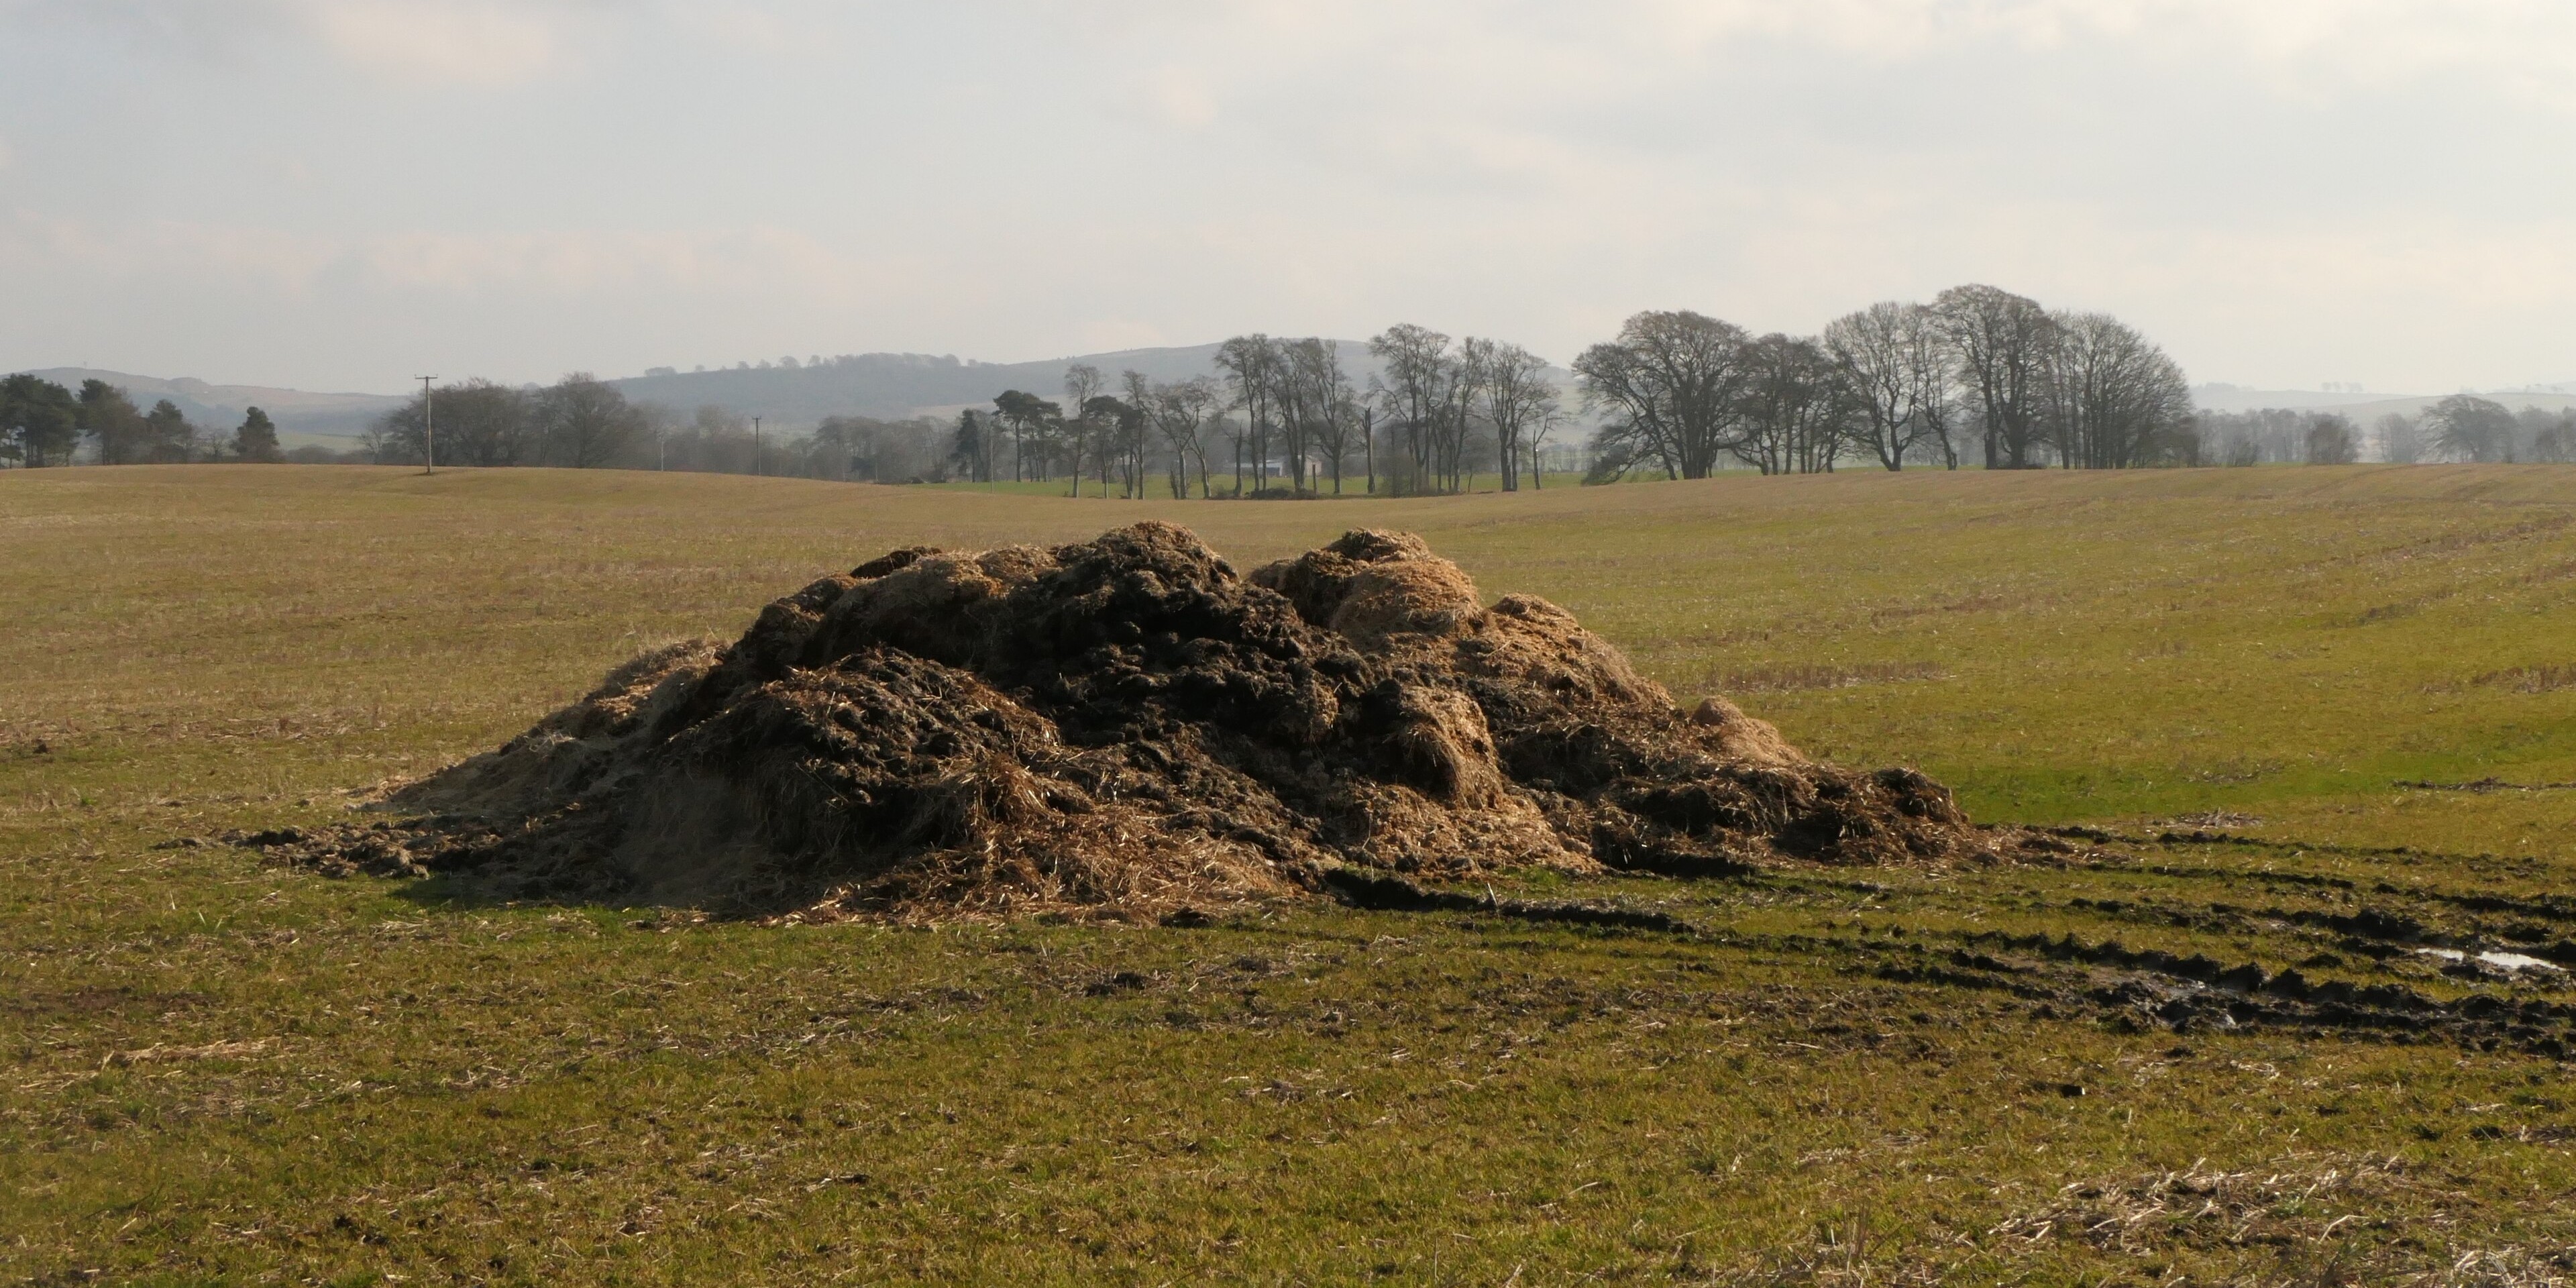
However, globally, 40% of total N2O emissions come from human activities. The main sources of human-caused N2O emissions are fertilized agricultural soils and livestock manure (42%) and the runoff of fertilizers (25%). 

The global warming potential of N2O is 265.

Source: Environmental Protection Agency
Fluorinated Gases (HFCs, PFCs, NF₃, SF₆)

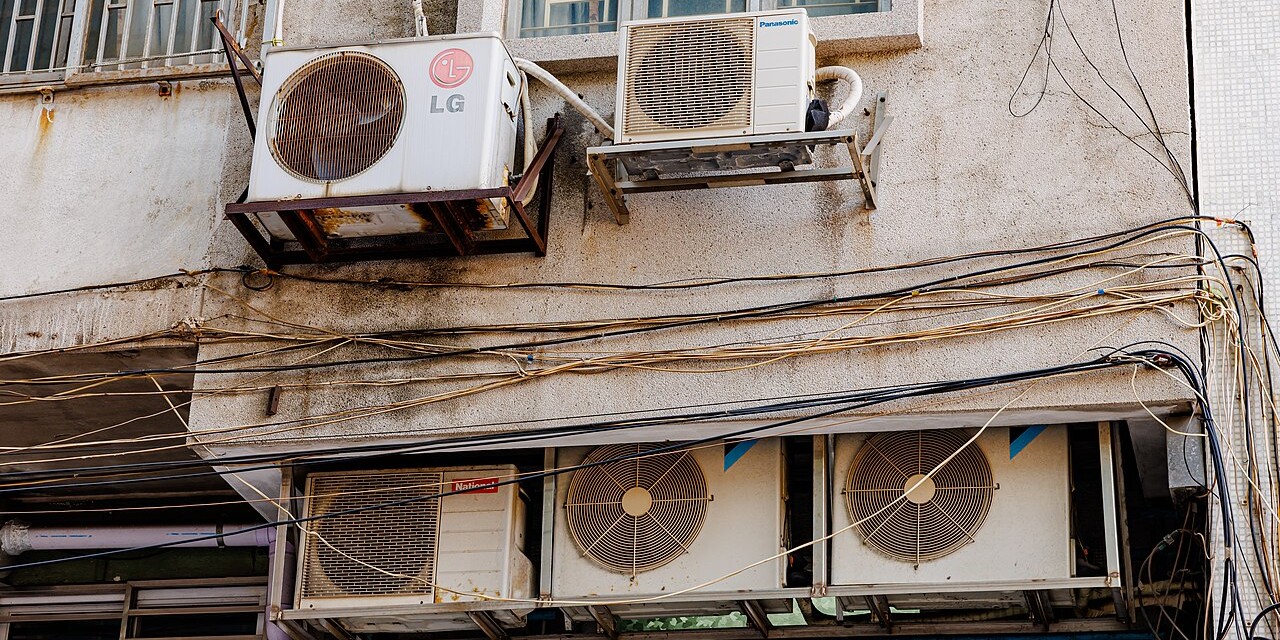
Unlike many other greenhouse gases, fluorinated gases have no significant natural sources and come almost entirely from human-related activities. They are emitted through their use in cooling appliances (e.g. refrigerators, freezers, and air conditioners) and through a variety of industrial processes such as aluminum and semiconductor manufacturing.

Many fluorinated gases are removed from the atmosphere only when they are destroyed by sunlight in the upper atmosphere. Many fluorinated gases have very high GWPs in the thousands or tens of thousands.

Source: Environmental Protection Agency
Human Caused Emissions

In the past, the Earth's climate has changed from various natural causes:

  • changes in energy from the sun
  • massive, sustained volcanic eruptions
  • predictable cycles in the Earth’s orbit that drive the ice ages and the warm periods in between

All of these are factors that have caused the Earth to become warmer or cooler in the past.

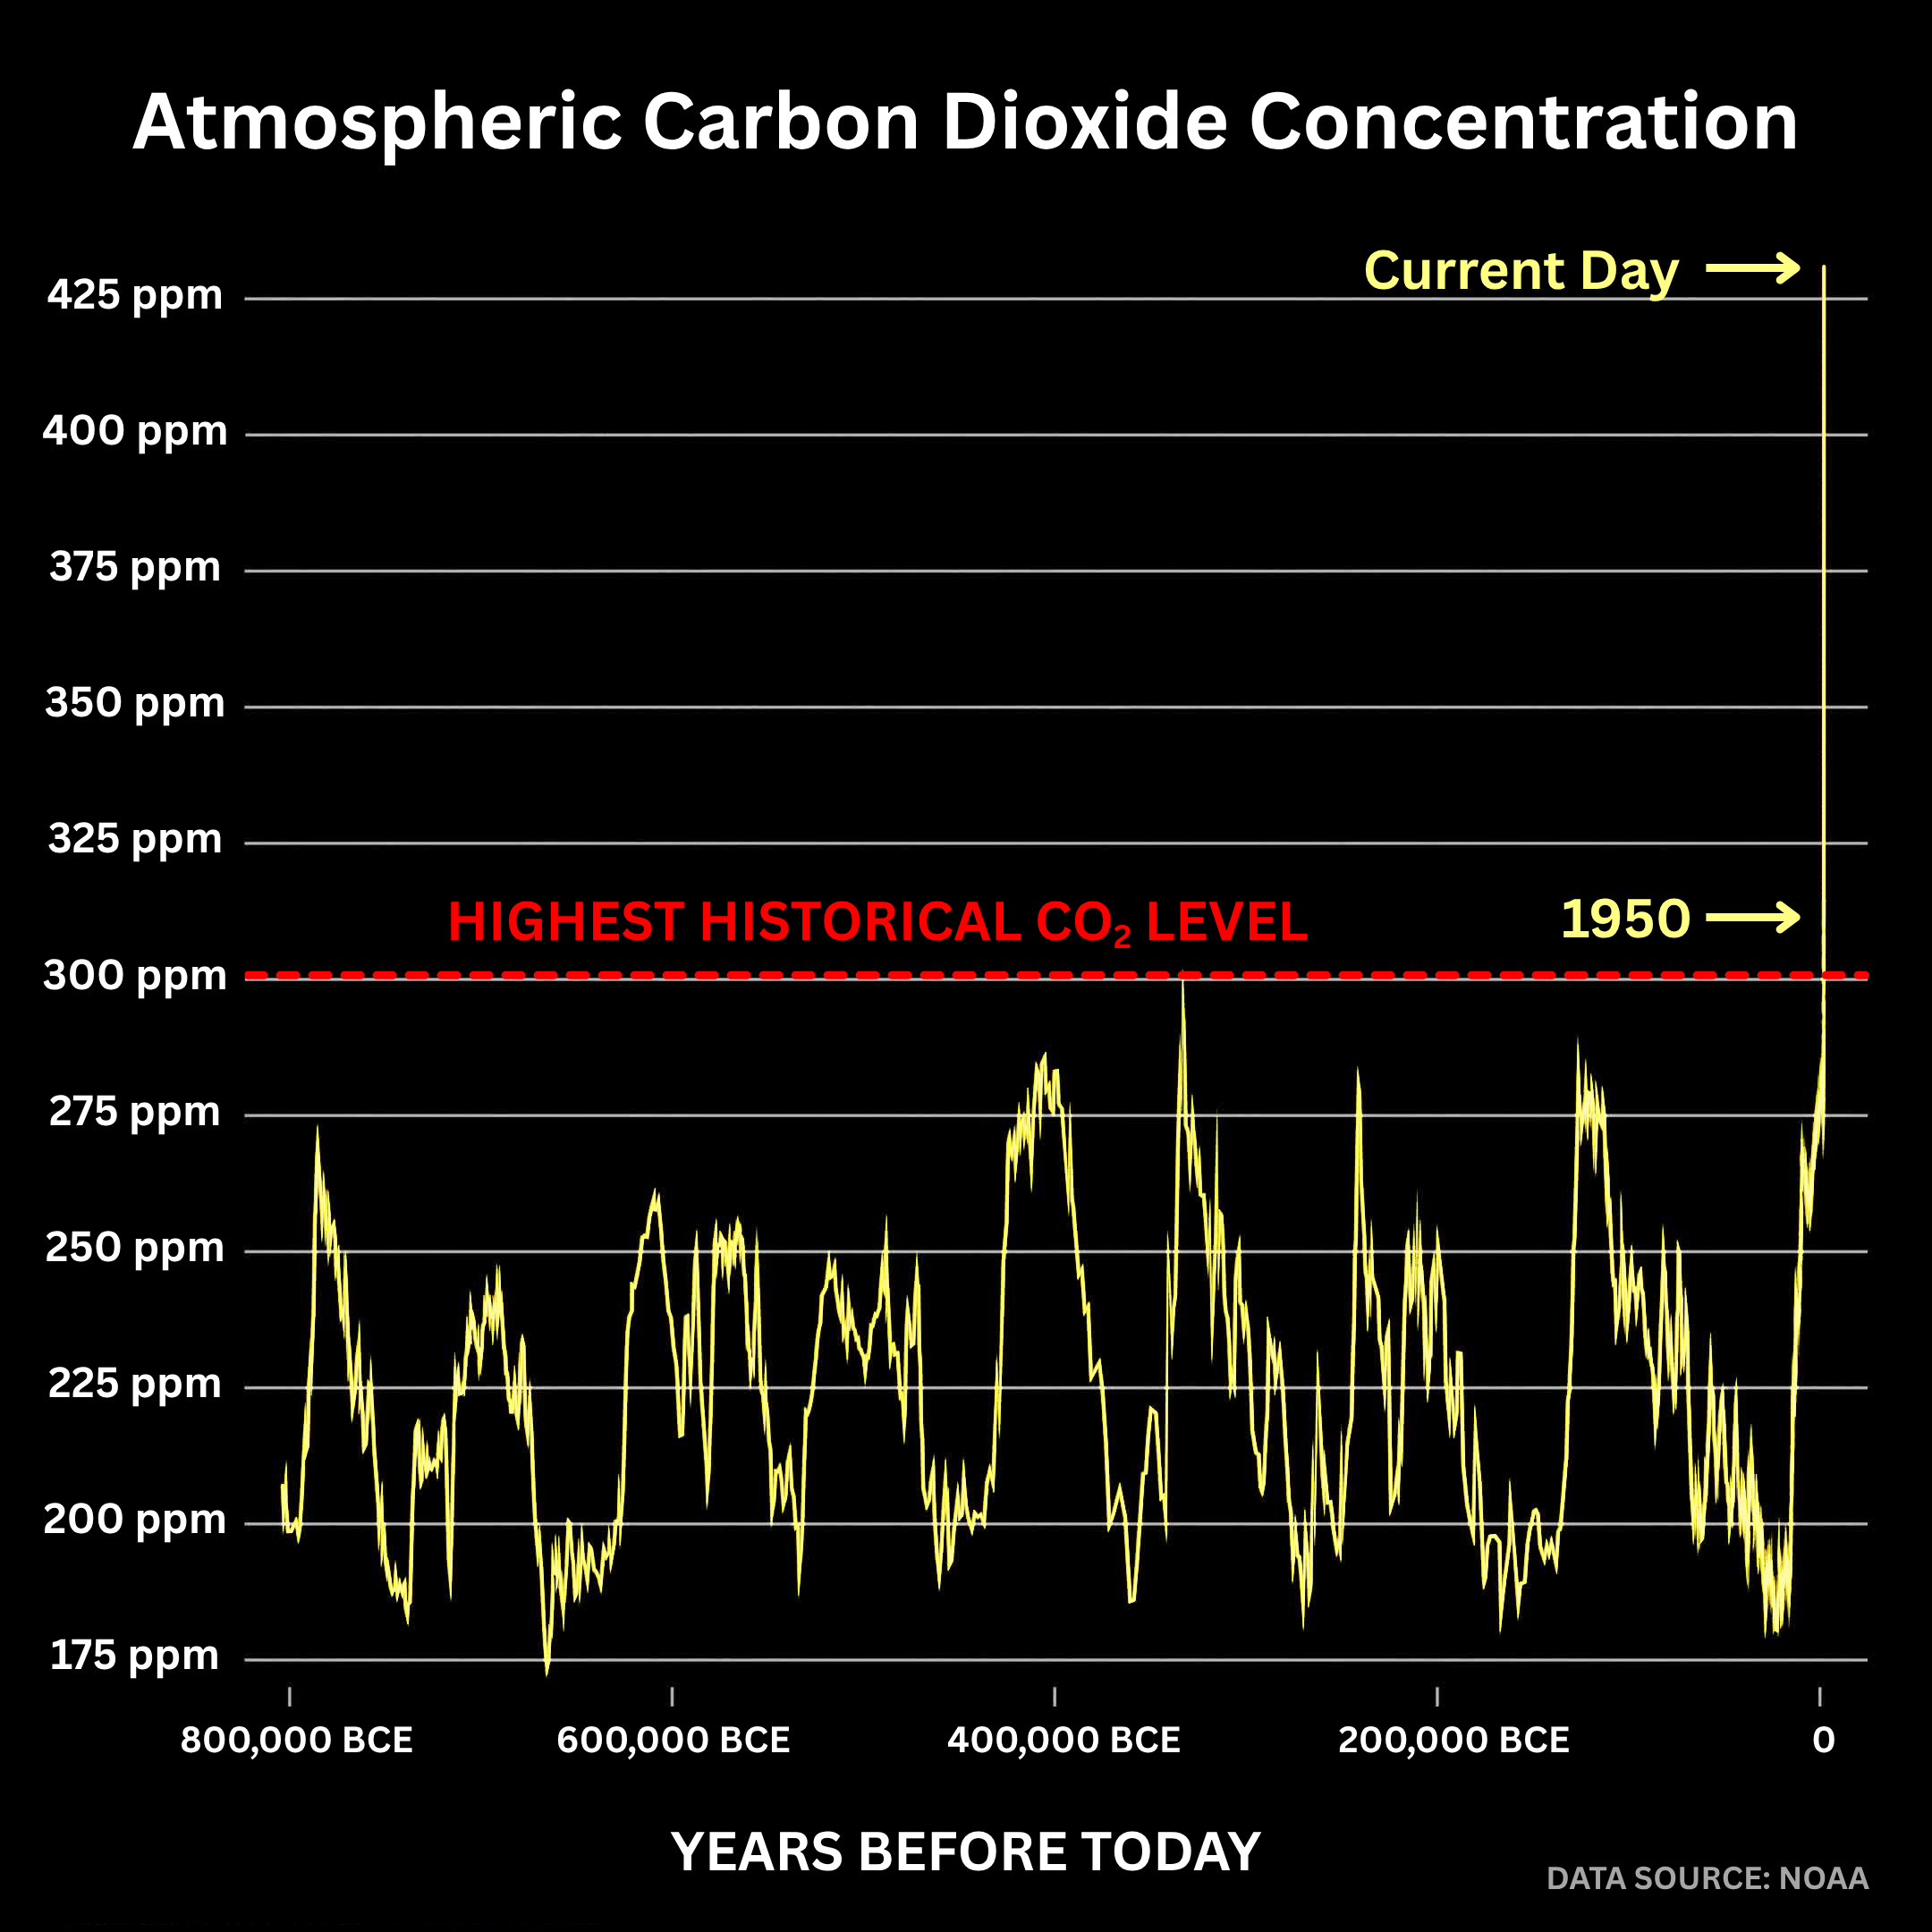
However, since the beginning of the Industrial Era (1850), human activities, such as the burning of fossil fuels, have raised atmospheric concentrations of CO2 by nearly 49%.

The graph to the right is a record of CO2 in Earth's atmosphere and illustrates both natural factors and human additions of CO2. The data is compiled from Antarctic ice cores in combination with observations from the Mauna Loa Observatory in Hawaii.

The upward climb of CO2 over the decades is due to human activities, primarily from burning fossil fuels. The sawtooth pattern of ups and downs year after year is due to a seasonal cycle of plant growth across the world.

The increase in global carbon dioxide levels from 1950 to 2022 (current) is more than what had happened naturally over a 20,000 year period.

Projected Changes & Impacts

GLISA, Climate Adaptation Partnerships (CAP), along with the City of Grand Rapids created a summary of historic as well as projected changes in climate specific to Grand Rapids, MI. This information is valuable in helping us understand what changes we have already experienced as well as what changes we anticipate. For a look at the full report, click here

Essentially, Grand Rapids will see more days over 90°F in the summer and warmer days in the winter. Grand Rapids will also experience more rain and extreme weather events in shorter bursts that could cause an increase in flooding and droughts. 

Click on a topic to learn more:

Average air temperature is projected to rise 3°F to 5°F by the mid-21st century, with summer having the greatest increases of 4°F to 7°F.  

Historically Grand Rapids had on average 7.9 days per year over 90°F; by mid-century this is projected to rise from 20-38 days per year over 90°F.

Total annual precipitation has increased by 16%.  

 Average annual precipitation in Grand Rapids is projected to increase by up to 3 inches by mid-century and by up to 7 inches by the end of the century, though types of precipitation will vary (i.e., more winter precipitation in the form of rain).

The total volume of rainfall in extreme events (heaviest 1% of storms) has increased by 52%.

Grand Rapids is projected to experience an increase of up to 1.7 days of heavy precipitation (days with over 1” of rainfall) per year by mid-century and by up to 3 days per year by end of century. 

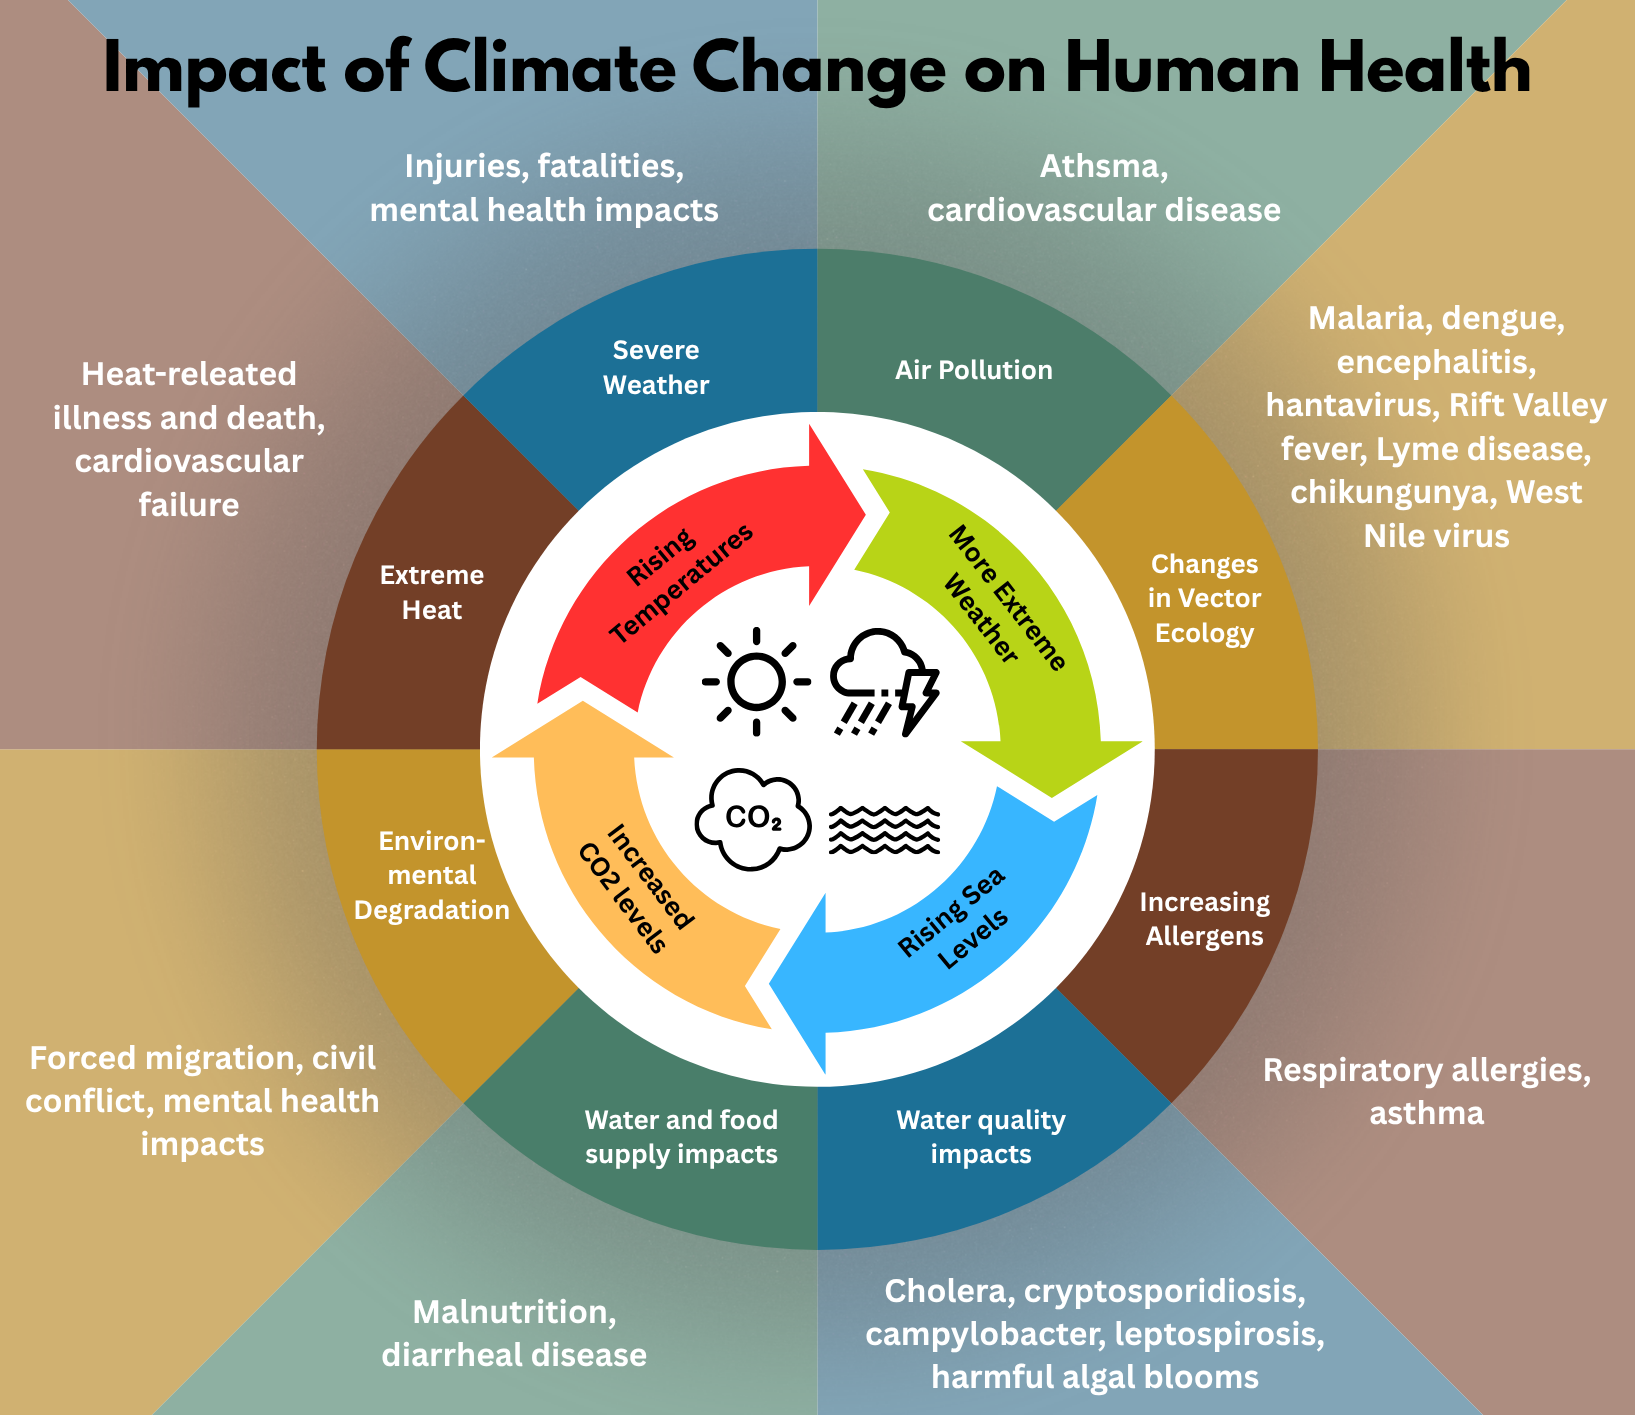
One of the most important impacts of climate change is the impact on our human health. The following are potential health impacts expected for those who reside in Michigan according to the Michigan Department of Health and Human Services and the Centers for Disease Control and Prevention (CDC).

  • Allergies - Climate projections predict an earlier and longer season for plants with pollen, which could increase allergies.
  • Heat Related Health Issues - Health effects such as heat cramps, heat exhaustion, heat dizziness, and heat stroke can happen during high temperatures when the body is not able to cool itself by sweating. Heat waves can also worsen chronic conditions including cardiovascular disease and diabetes-related conditions.
  • Impacts on Pregnancy - Environmental pollution, such as small particles in our air from smoke, has been linked to increased risk of negative birth outcomes, including premature birth. Exposure to fine particulate matter (PM2.5) from vehicle exhaust, industrial processes, or wildfire smoke has been found to impact the metabolism of pregnant people and increase risk.
  • Waterborne Diseases - Increases in waterborne disease outbreaks have been reported following a heavy rainfall. Buildings that experience water intrusion can develop mold contamination, which can lead to indoor air quality problems.
  • Vector-Borne Diseases - With the incoming of warmer winters, earlier springs, and warmer summers, climate change creates ideal conditions for vector-borne diseases such as West Nile Virus and Lyme Disease to flourish from an increase in mosquitos and ticks.
  • Mental Health - Climate change and related disasters cause elevated levels of anxiety, depression and post-traumatic stress disorders. The trauma and losses from a disaster, such as losing a home or job and being disconnected from neighborhood and community, can contribute to depression and anxiety. Extreme weather events have also been associated with increases in aggressive behavior and domestic violence. 

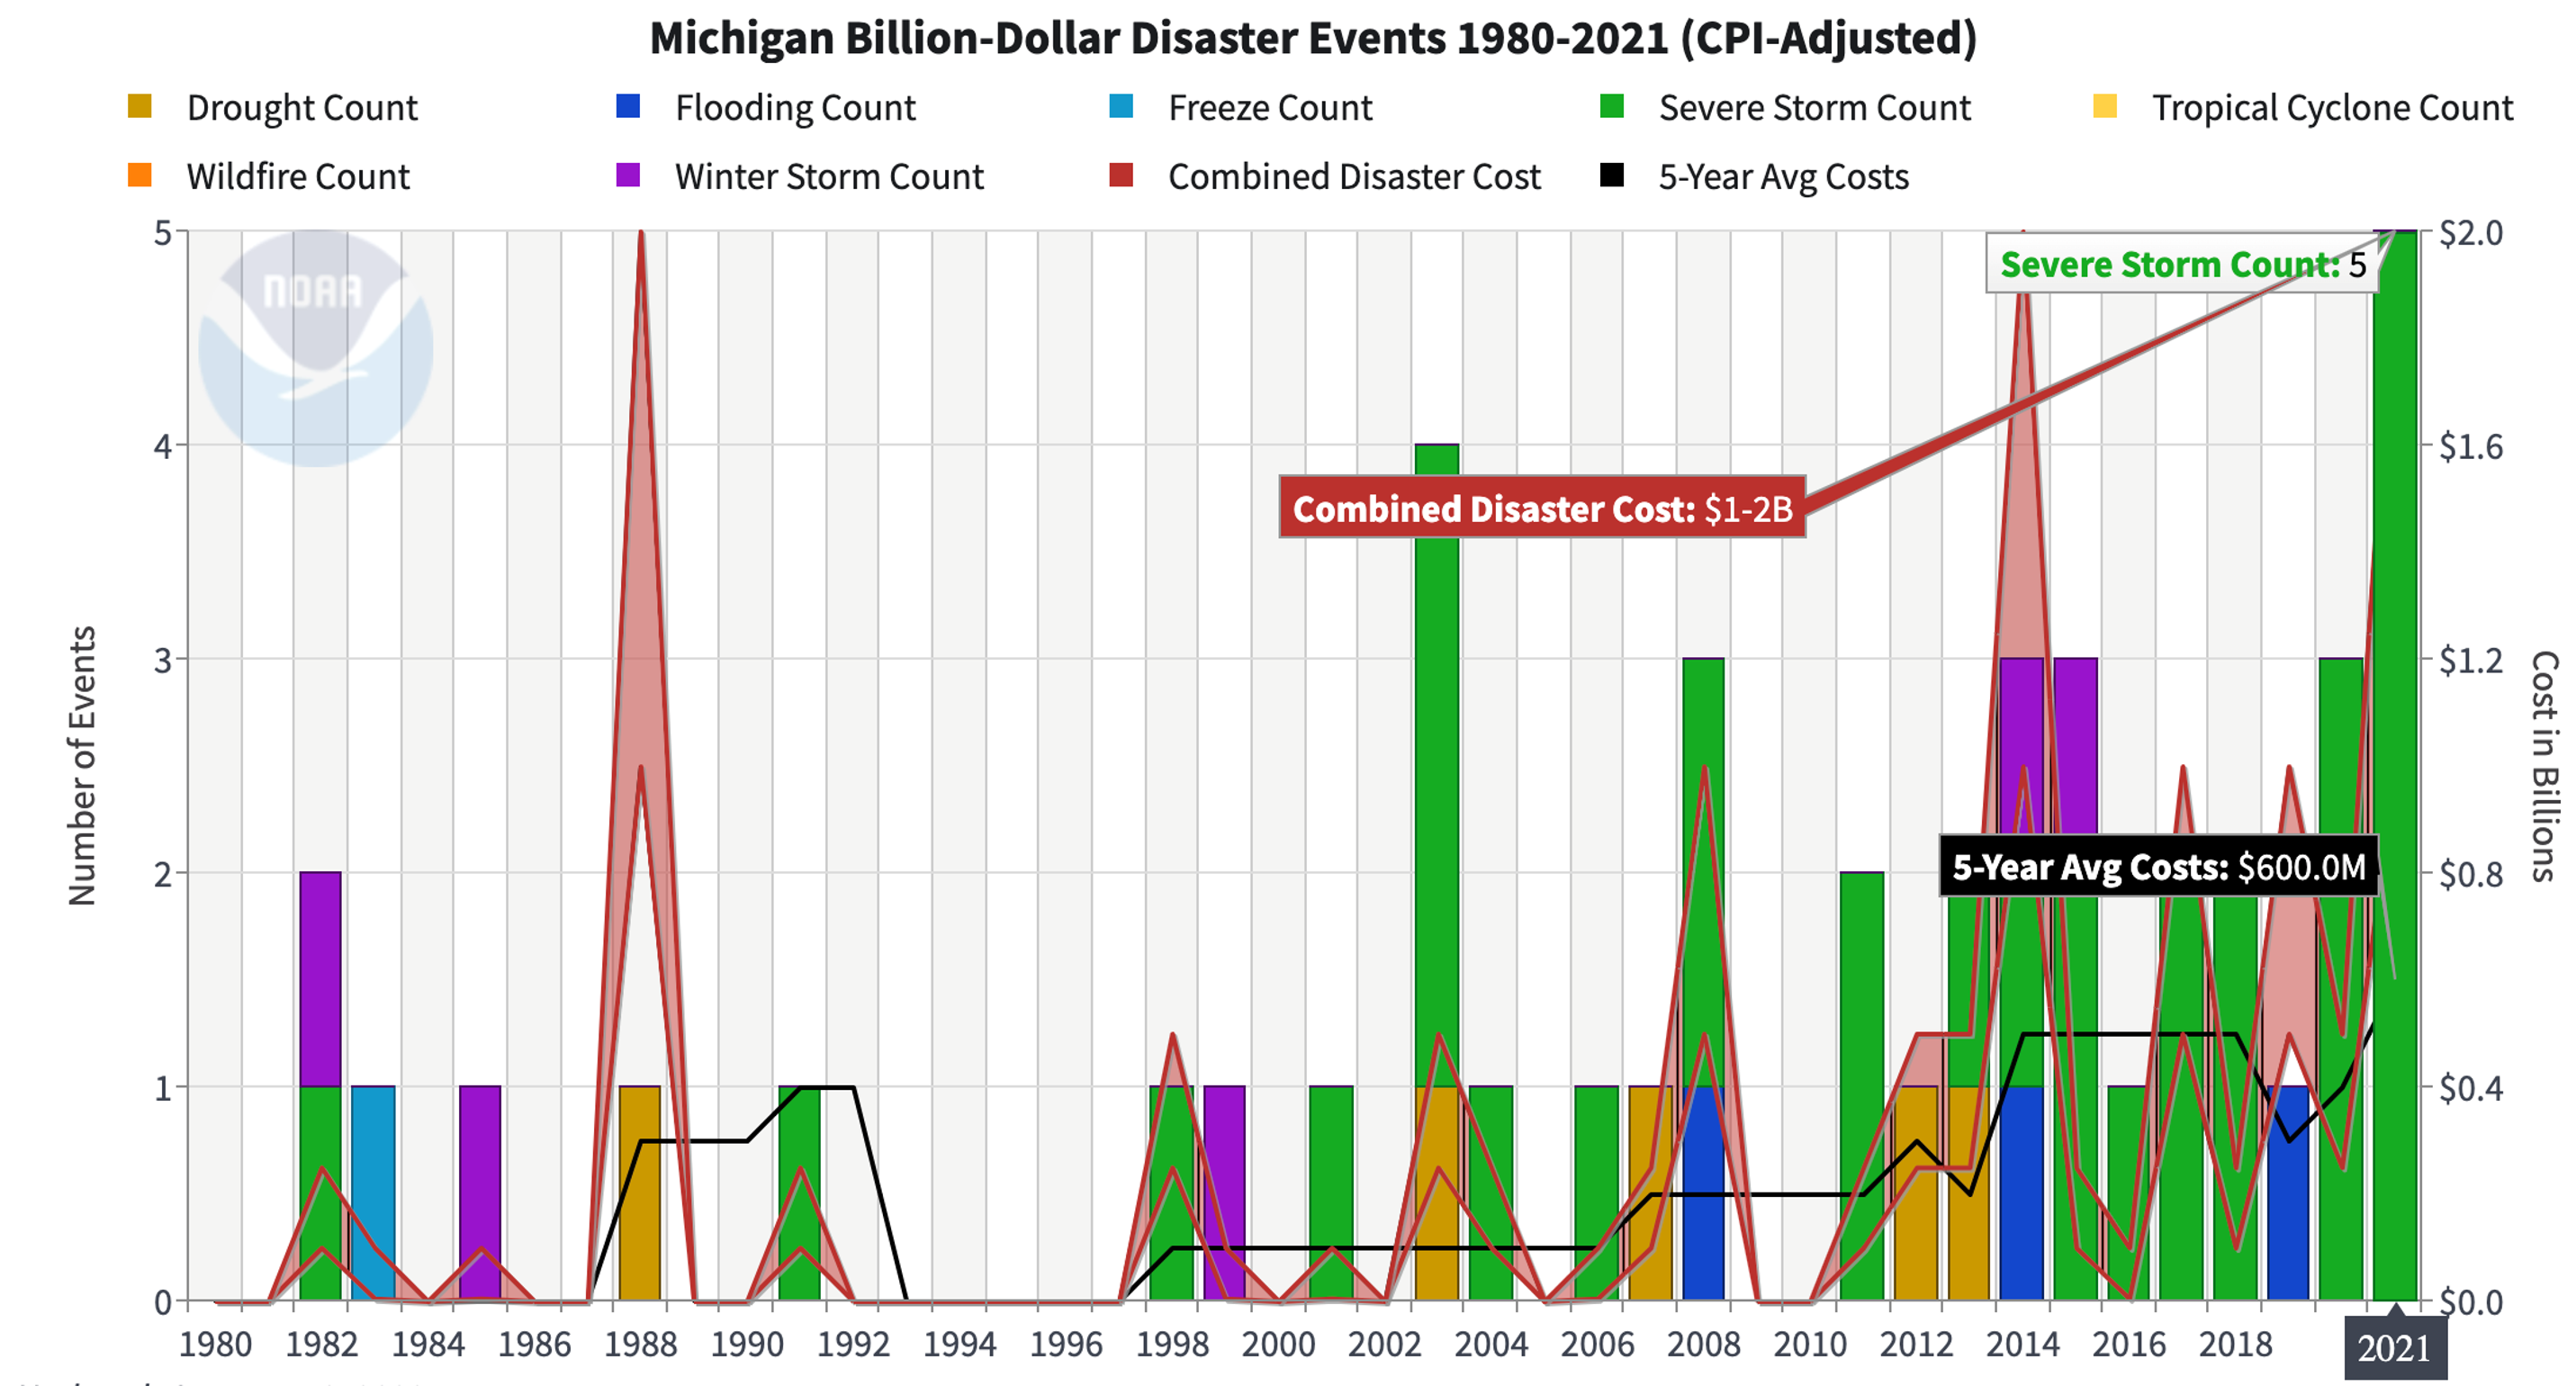
Another reason to plan for climate change is to prepare for the economic impact of ever increasing billion-dollar disaster events. While taking a look at this graph note that this is only for the state of Michigan, with the most common disaster events including severe storms, floods and drought.

As you can see from the 1980s to the early 2000s, numbers were fairly low, but there is a steady rise in the amount of billion dollar disaster events from 2011 to 2021, and for 2021 there is a combined disaster cost of 1 to 2 billion dollars. 

Climate change is also known as a threat multiplier or an accelerant of instability, which means that it has the potential to exacerbate other social forces such as water, food, and energy insecurity, as well as racial and low-income disparities.

Those most impacted by climate change are those who contributed least to the issue due to increased exposure to climate hazards, higher sensitivity, and a lower adaptive capacity.  This includes women and low-income populations globally, Indigenous peoples, and Black and Brown neighborhoods in the U.S. that may reside in flood zones, without green space, and potentially near toxic industry sites due to the racist practice of redlining.

Due to redlining, not all Grand Rapids neighborhoods will experience the impacts of climate change equally. Communities that were redlined remain those with a larger percentage of people of color and low-income residents. They are also the same neighborhoods that have fewer trees and green spaces, making them more vulnerable to heat and flooding. 

In 2021, the EPA released a report that showed that in the U.S. the most severe harms from climate change fall disproportionately upon underserved communities who are least able to prepare for, and recover from, heat waves, poor air quality, flooding, and other impacts.  EPA’s analysis indicated that communities of color are particularly vulnerable to the greatest impacts of climate change.

For local knowledge on how environmental action intersects with race read LINC UP's Neighborhood Environmental Action Report: Health, Environment and Race in Grand Rapids

Some additional effects we’ll see in West Michigan are an increase in lake levels. Research indicates climate change will drive water levels higher with Lake Superior expected to rise on an average by 7.5 inches, while levels on the Lake Michigan-Huron system is projected to increase 17 inches by mid century.

More lake effect snow for the time being will also be an ecosystem impact. In a warmer atmosphere, water evaporates faster, so when a storm comes around there is more water vapor waiting to be swept into the storm, creating more intense storm events.

For the Great Lakes this is creating more lake-effect snow – since warm lake water is evaporating into the atmosphere, but temperatures are remaining below freezing. So West Michigan sees more snow, and that is going to continue. This could impact the quality of our roads, the number of power outages and our community’s ability to accommodate trucking industry.

Another effect of a warmer atmosphere and then warming lakes is an increase in harmful algal blooms. As the temperature rises in lakes potentially toxic algae numbers will increase creating nutrient pollution and killing fish species. An increase in algal blooms is not only harmful to human and ecosystem health, but also to fishing tourism and traditional Anishinaabe cultural practices, such as water walks.  

Climate migration is the movement of people due to climate or the effects of climate change. The Midwest has been called a potential climate haven – where people will potentially move to avoid the worst effects of climate change.

Grand Rapids is primed to be a “climate haven” or safe place for people to move to with a diverse job market, population growth, good schools, cultural offerings, comparatively moderate climate, and access to water.

Unfortunately, climate migration will exacerbate already existing inequities within our community – our focus for now is to address those inequities, and to increase quality of life and resilience of our community in the hopes that we will better be able to prepare for what’s to come.  

Mitigation & Adaptation

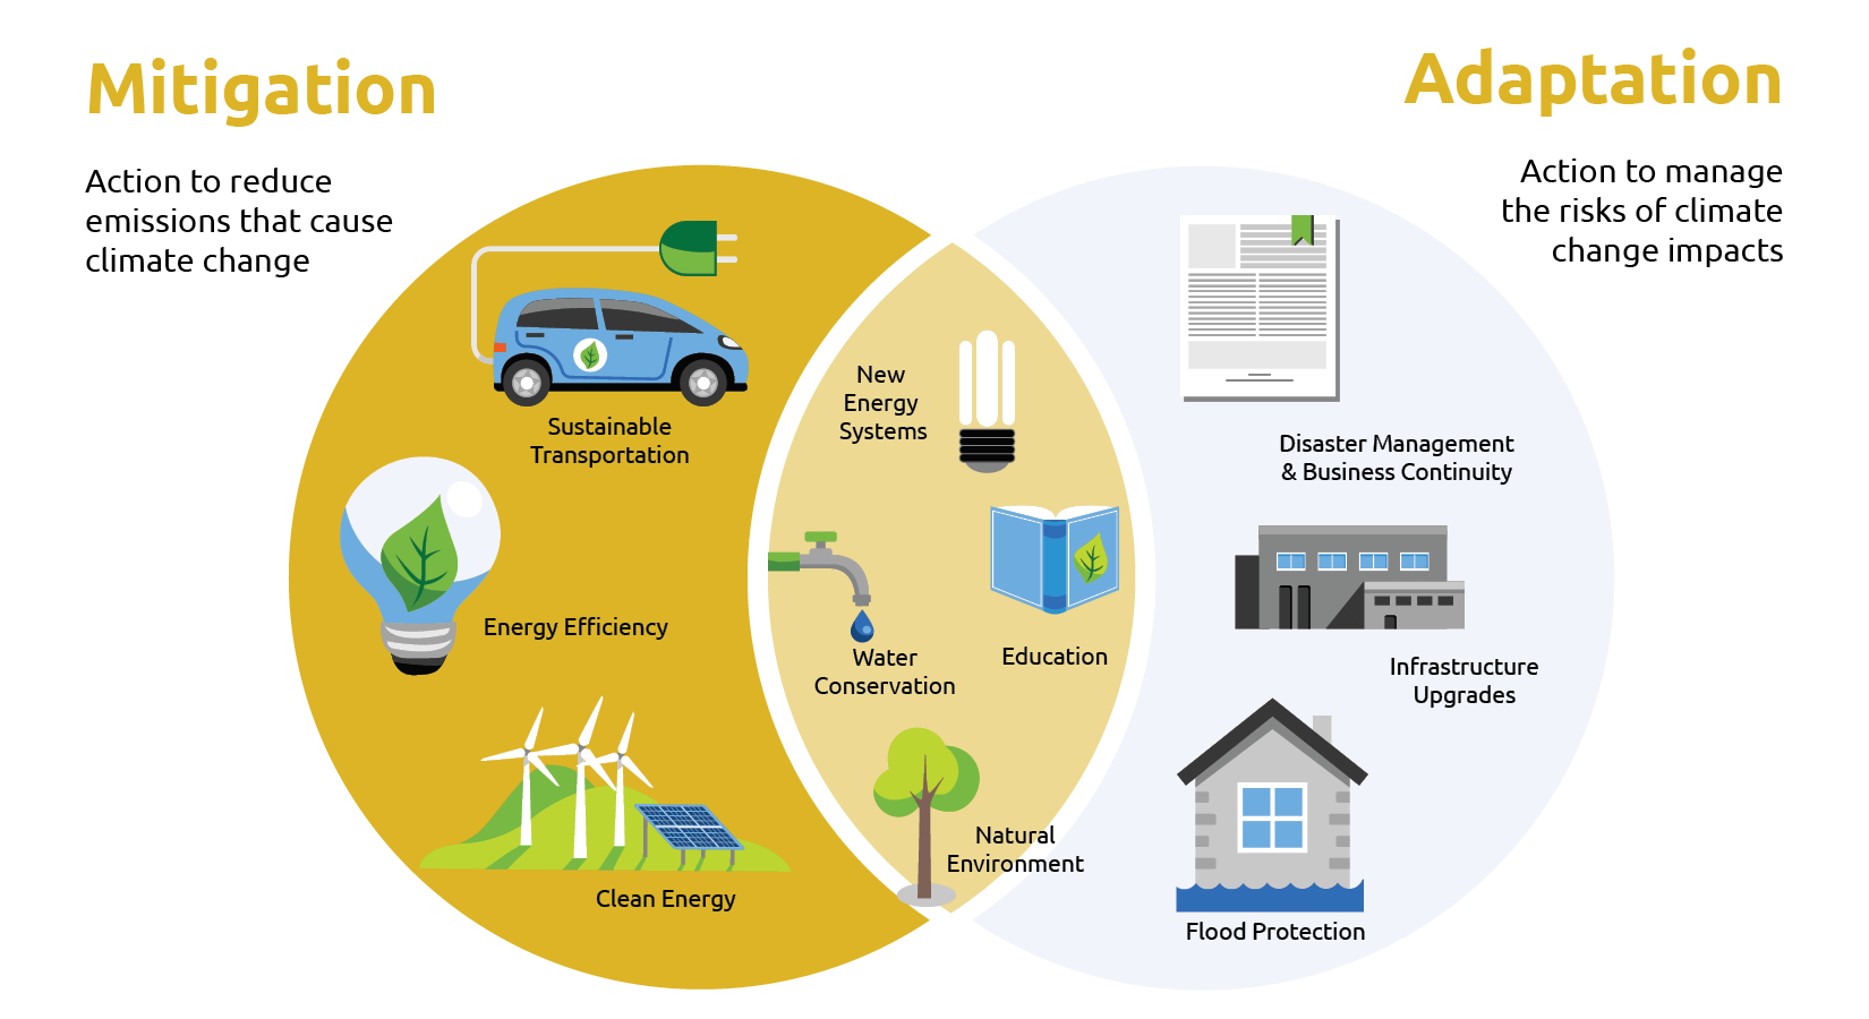
In climate change work there are two types of solutions: climate mitigation and climate adaptation

Mitigation is reducing, or preventing, GHGs by decreasing how much energy is consumed (or energy efficiency), ensuring energy is produced from renewable sources (such as wind, solar, etc.), and finding ways to capture and store greenhouse gases (known as sequestration). 

Adaptation is taking actions that reduce or prevent the harm caused by climate change and can include planning for impacts that are predicted to occur, putting processes in place to respond when anticipated changes occur, and being creative with new solutions (like businesses or energy systems) to adapt to our new normal.  

Environmental & Climate Justice

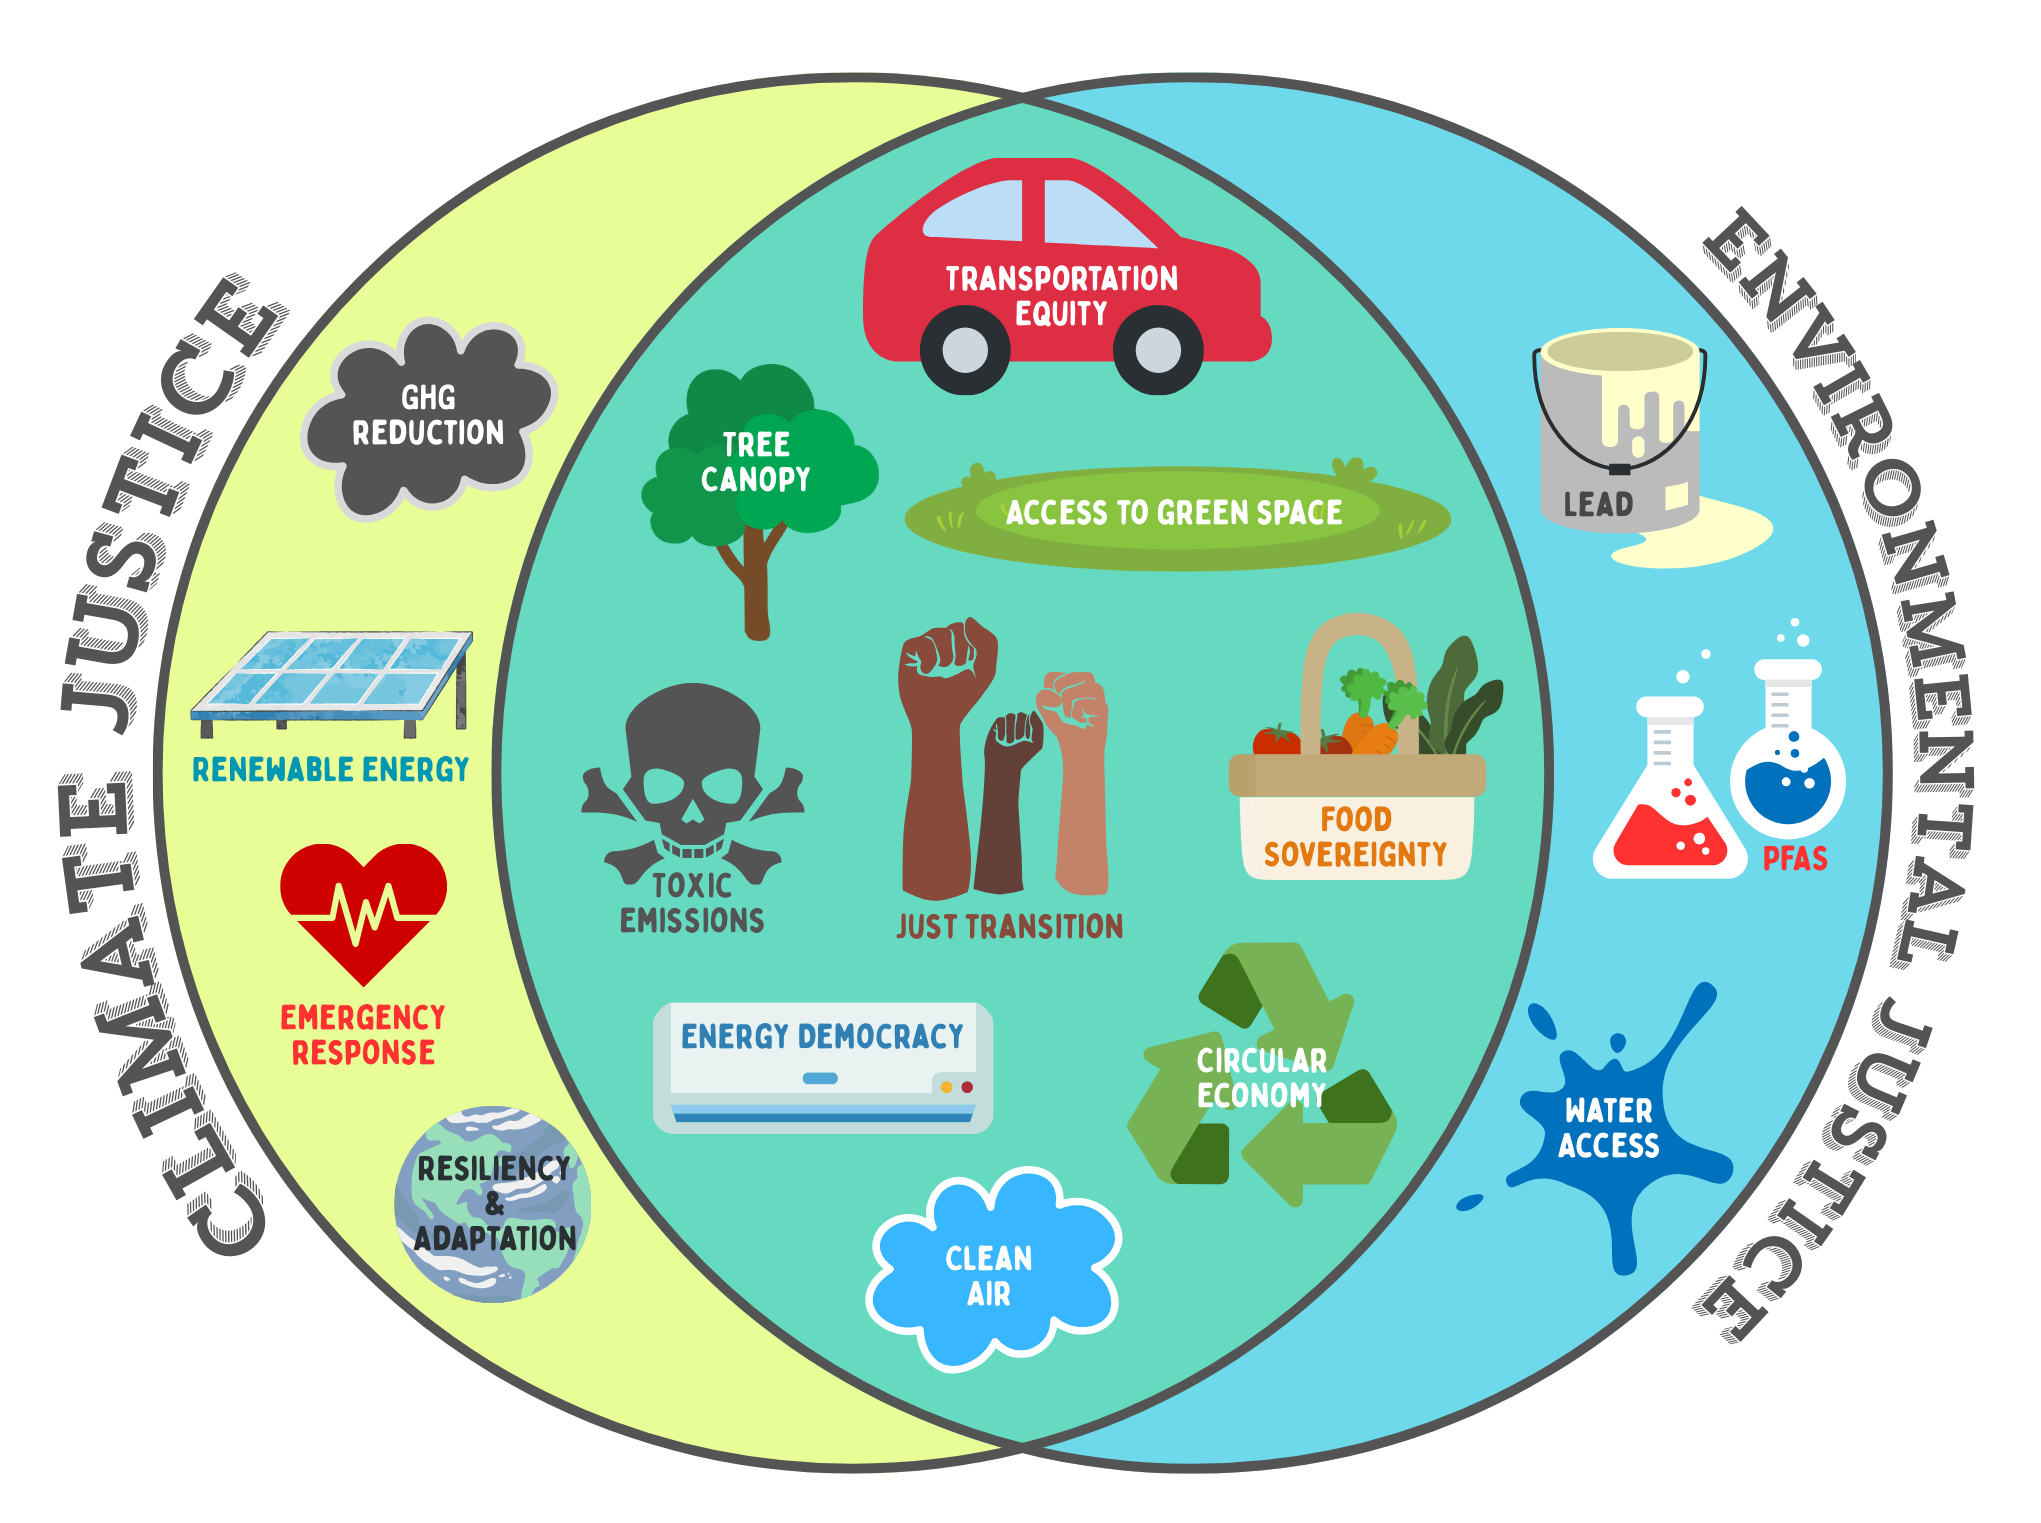
The climate justice movement addresses the ethical dimensions of climate change - shifting from talk about greenhouse gases, melting ice caps and polar bears into a civil rights movement with the people and communities most vulnerable to climate impacts at its heart.  

Climate justice seeks to integrate justice into climate solutions. Some of these solutions include just transition, energy democracy, transportation equity, food sovereignty, and efficient, affordable housing. 

Environmental and climate justice both uphold the fundamental rights to clean air, land, water, and food that is free from pollution and destructive practices. While these concepts are closely interlinked, they are each defined as:

  • Environmental justice - For communities disproportionately affected by these harms (hazardous waste, resource extraction, etc.) environmental justice can include the restoration of ecosystems, abatement from hazards such as lead or PFAS, or addressing sources of air, water, or soil pollution.

  • Climate justice focuses on delivering climate solutions to vulnerable communities who are already experiencing these impacts “first and worst”. Presently, West Michigan faces threats of heat stress, increased flooding, and unhealthy air as the frequency of severe weather rise due to a changing climate. Climate justice includes enhancing access to renewable & efficient energy, healthy food, and improving homes to be resilient to extreme weather. While building climate resiliency & adaptive measures in the present, it is necessary to consider historical context of systemic oppression and extraction in marginalized communities.

A Just Transition

Just Transition is a vision-led, unifying and place-based set of principles, processes, and practices that build economic and political power to shift from an extractive economy to a regenerative economy. This means approaching production and consumption cycles holistically and waste-free. The transition itself must be just and equitable; redressing past harms and creating new relationships of power for the future through reparations.

Click on a topic to learn more:

Energy democracy pairs the renewable energy transition with efforts to democratize the production and management of energy. Energy democracy represents a shift from the corporate, centralized fossil fuel economy to one that is governed by communities, is designed on the principle of no harm to the environment, supports local economies, and contributes to the health and well-being for all peoples. 

Transportation is the number one source of carbon emissions in the U.S. In order to reduce our greenhouse gas emissions, a lot of focus is being placed on the solution of transitioning to electric vehicles but does not address equitable access to these vehicles. Transportation equity focuses on solutions that include both equitable access to new technologies for low-income and communities of color, while moving away from reliance on automotive vehicles and encouraging public transportation and forms of active mobility such as walking or biking.

“Food sovereignty is the right of peoples to healthy and culturally appropriate food produced through ecologically sound and sustainable methods, and their right to define their own food and agriculture systems. It puts the aspirations and needs of those who produce, distribute and consume food at the heart of food systems and policies rather than the demands of markets and corporations.” – Declaration of Nyéléni, the first global forum on food sovereignty, Mali, 2007

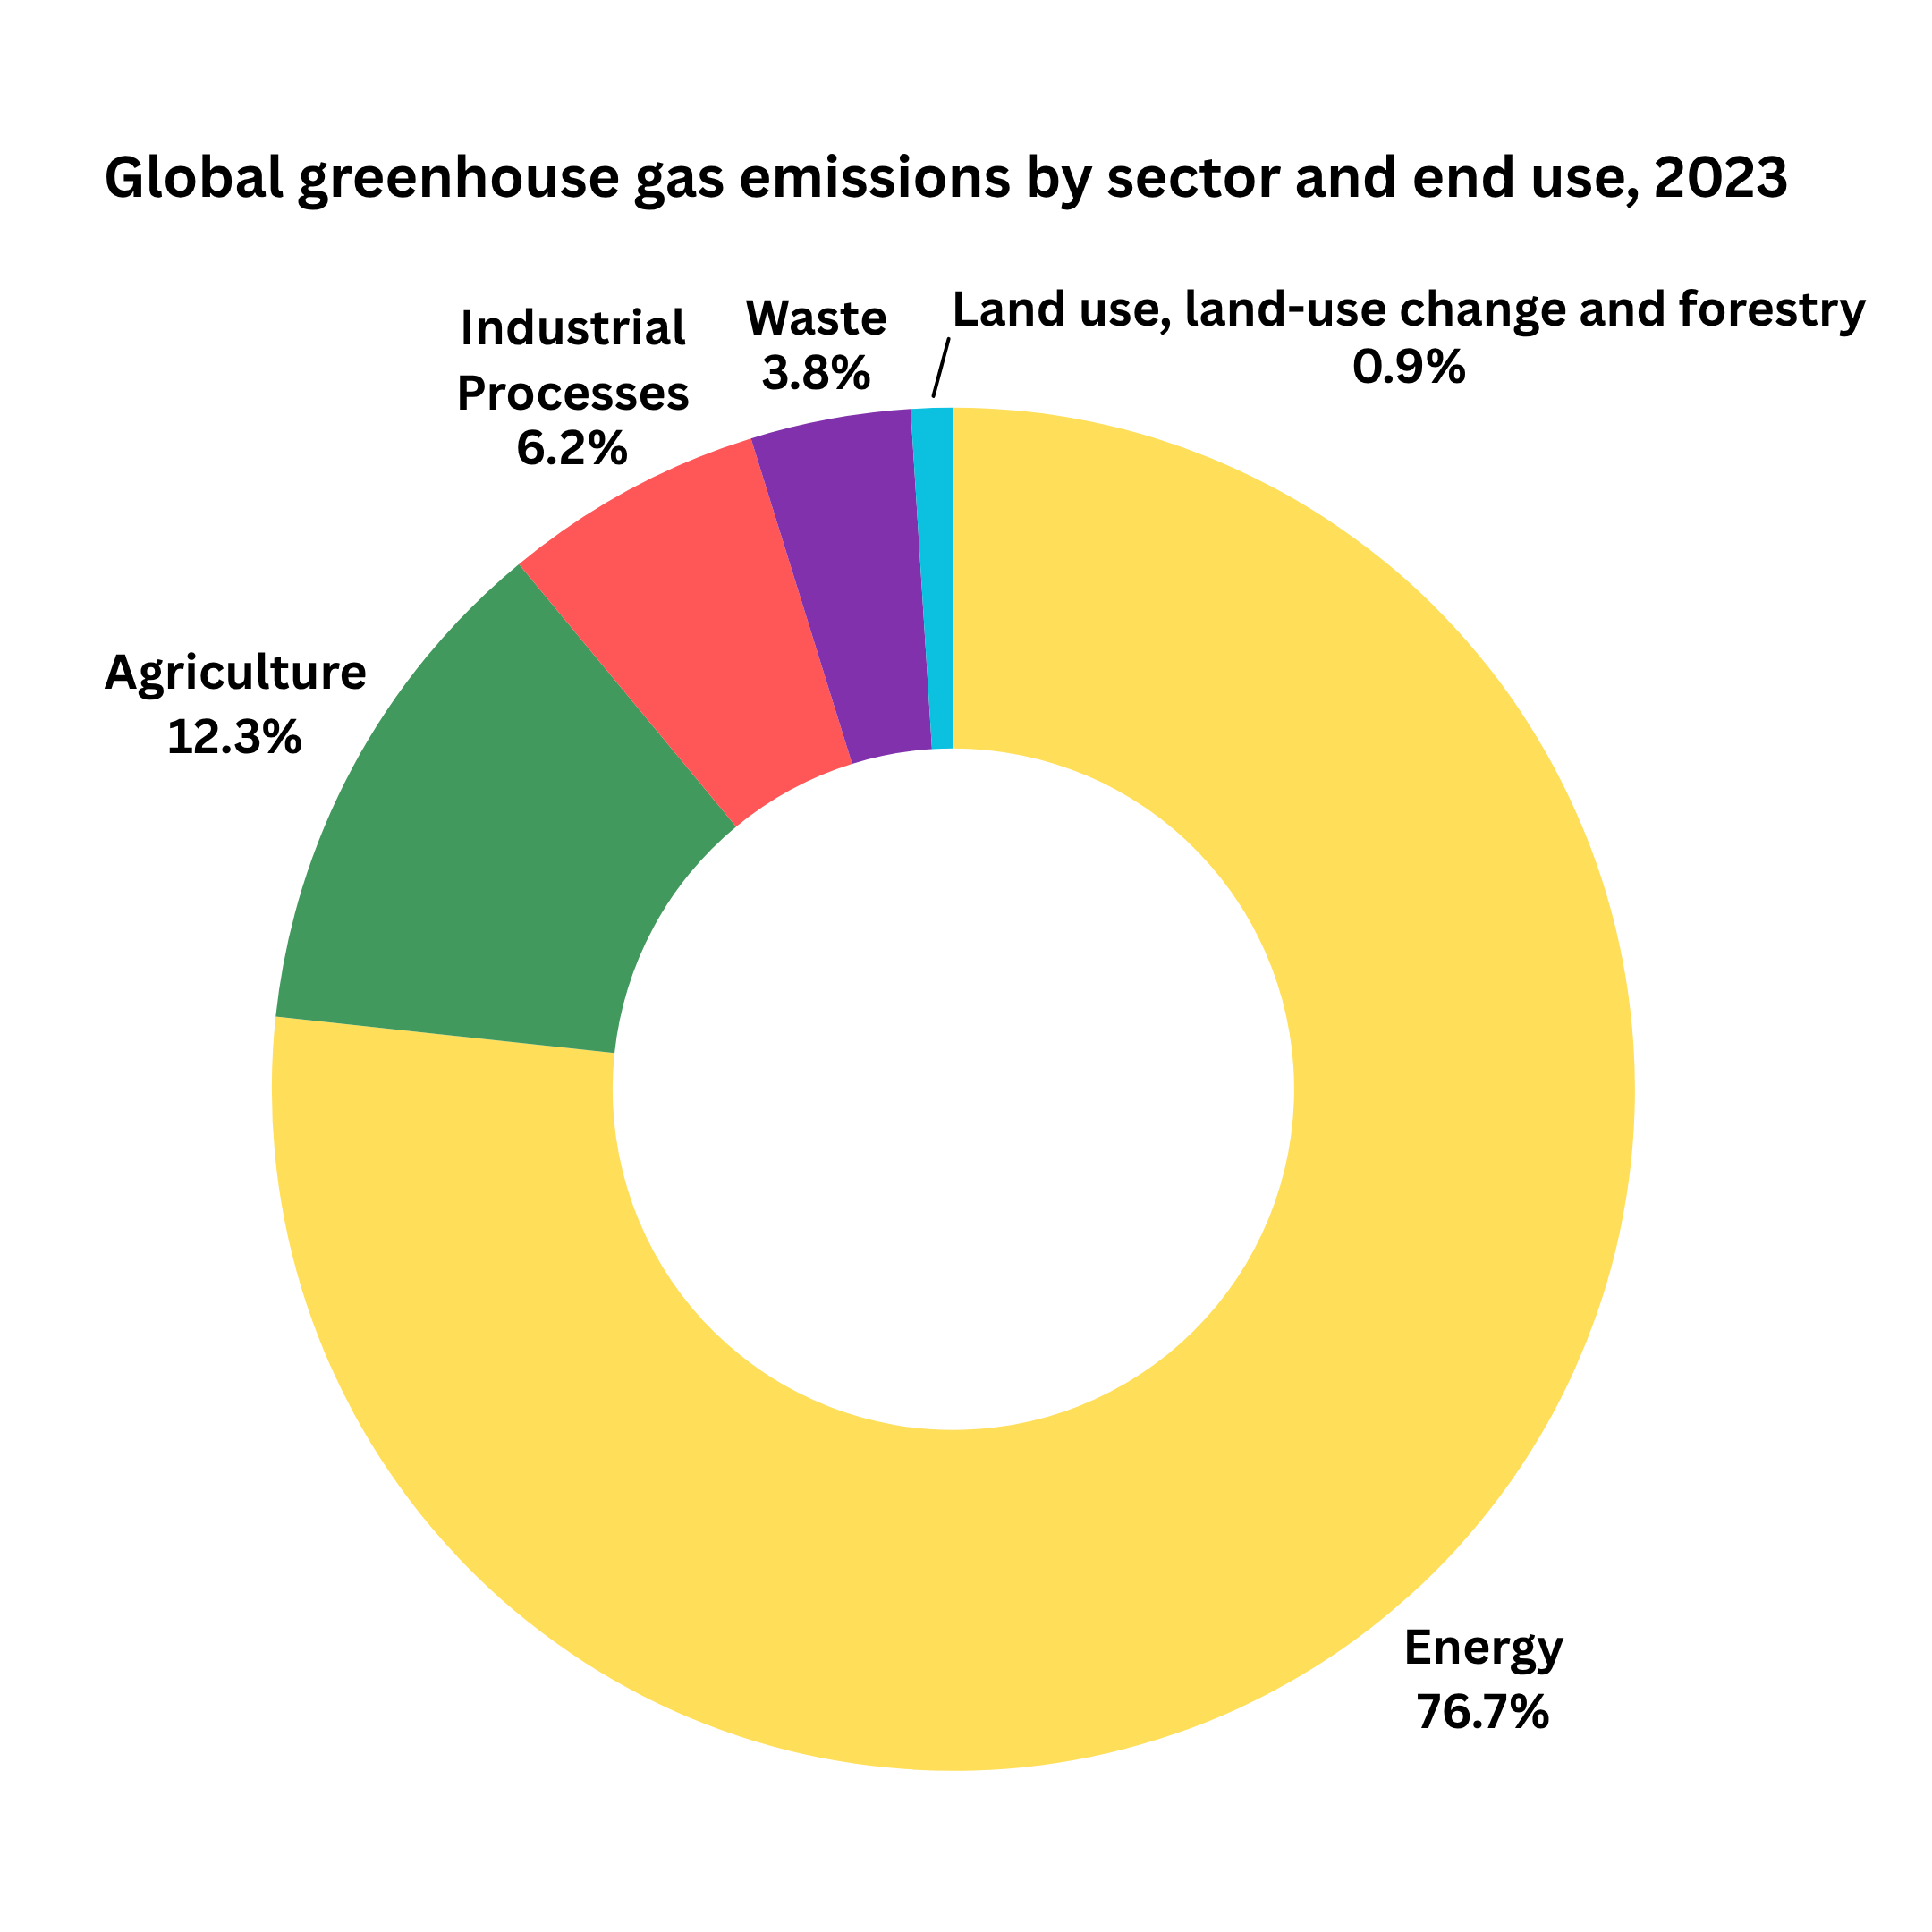
Through deforestation, farming, transportation, processing and packaging, refrigeration and retail, and waste, the industrial model of agribusiness – guided by generation of profits, exploitation of labor, commodification of the earth, and manipulation of natural systems – is a major contributor to the climate crisis. Between 44% and 57% of all greenhouse gas emissions come from the global food system. Food sovereignty solutions focus on investing in localized food, farming and distribution systems in urban and rural communities.

Energy cost burden more often falls on low-income households due to substandard housing. Climate change will likely deepen this problem due to ongoing and projected increases in average and extreme temperatures, which will expose those that cannot afford to maintain comfortable temperatures inside their homes to extreme heat. This exposure may lead to severe health consequences, including heat exhaustion and death from heatstroke. Increasing access to energy efficient, affordable housing is a key climate justice solution. 

City Staff Contact

Surface temperature video source: NASA Scientific Visualization Studio

Additional Resources

Check out our Climate Change Training Series on YouTube:

  1. Climate Change 101
  2. Communicating Climate Change
  3. Climate Solutions coming soon!
  4. Climate Justice coming soon!